Over the past few decades, the general discussion in industry has been that you cannot perform offline electrical- or motor-current-signature analysis (ESA and MCSA, respectively) on equipment in no-load conditions. In fact, some publications have suggested the need for 50% minimum load. The question has been posed to us a number of times recently during shop inspections and acceptance-testing work. In this article, we focus on a real-world situation to discuss why that narrative has been put forth, as well as why no-load testing can, in fact, be performed accurately in a repair environment.
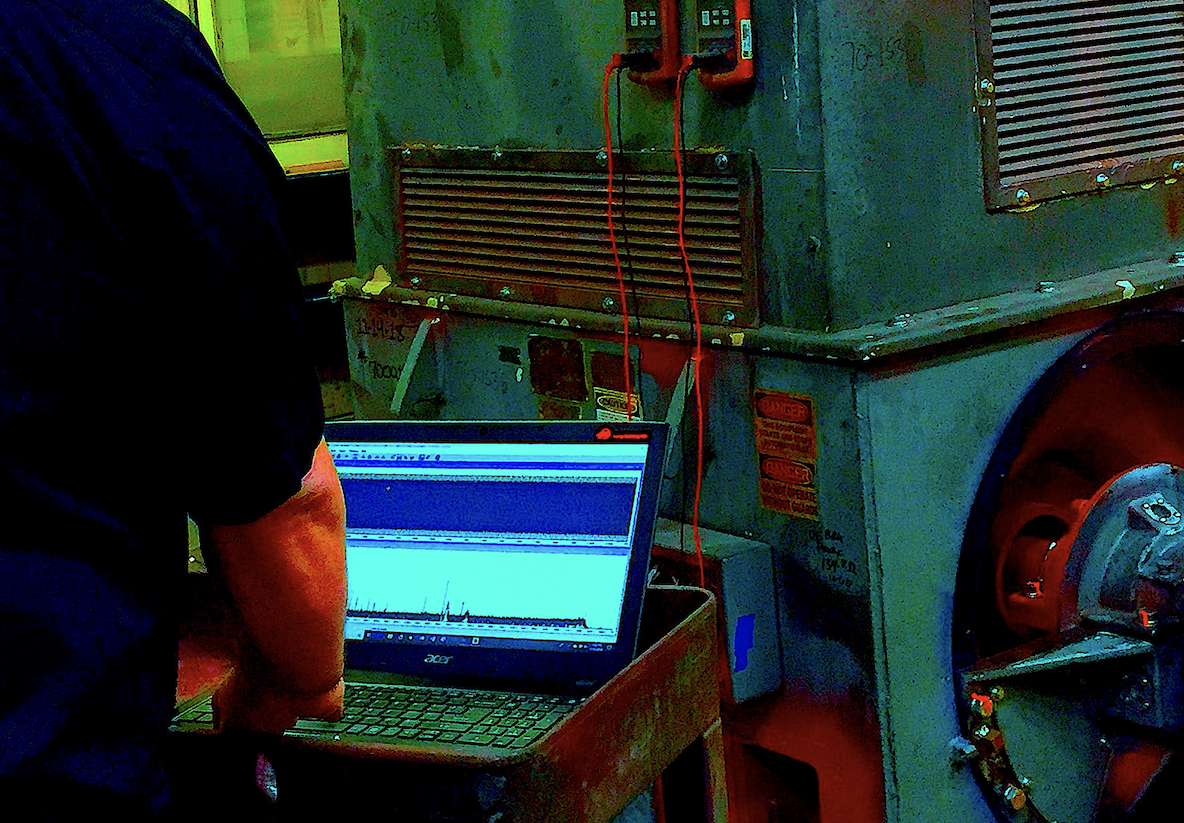
Fig. 1. Performing motor-current-signature-analysis testing for rotor bars and other defects in a repair shop.
The electric motor in question (Fig. 1) is a 900-hp, 3565-rpm, 196.5 Amp, 4160 Volt unit with 46 rotor bars and 54 stator slots. The motor had a high axial vibration and slightly lower radial vibration until it was balanced, then the radial vibration also increased. There are a few things that can cause that situation, including dynamic eccentricity or a bent shaft, certain rotor bar conditions (such as looseness) and a cocked rotor/stator core.
The motor was started with a manual soft-start, which normally shows a smooth speed increase. In this case, the RMS current was not very smooth, and there was a frequency component to the current that was regular (shown in Fig. 2 below).
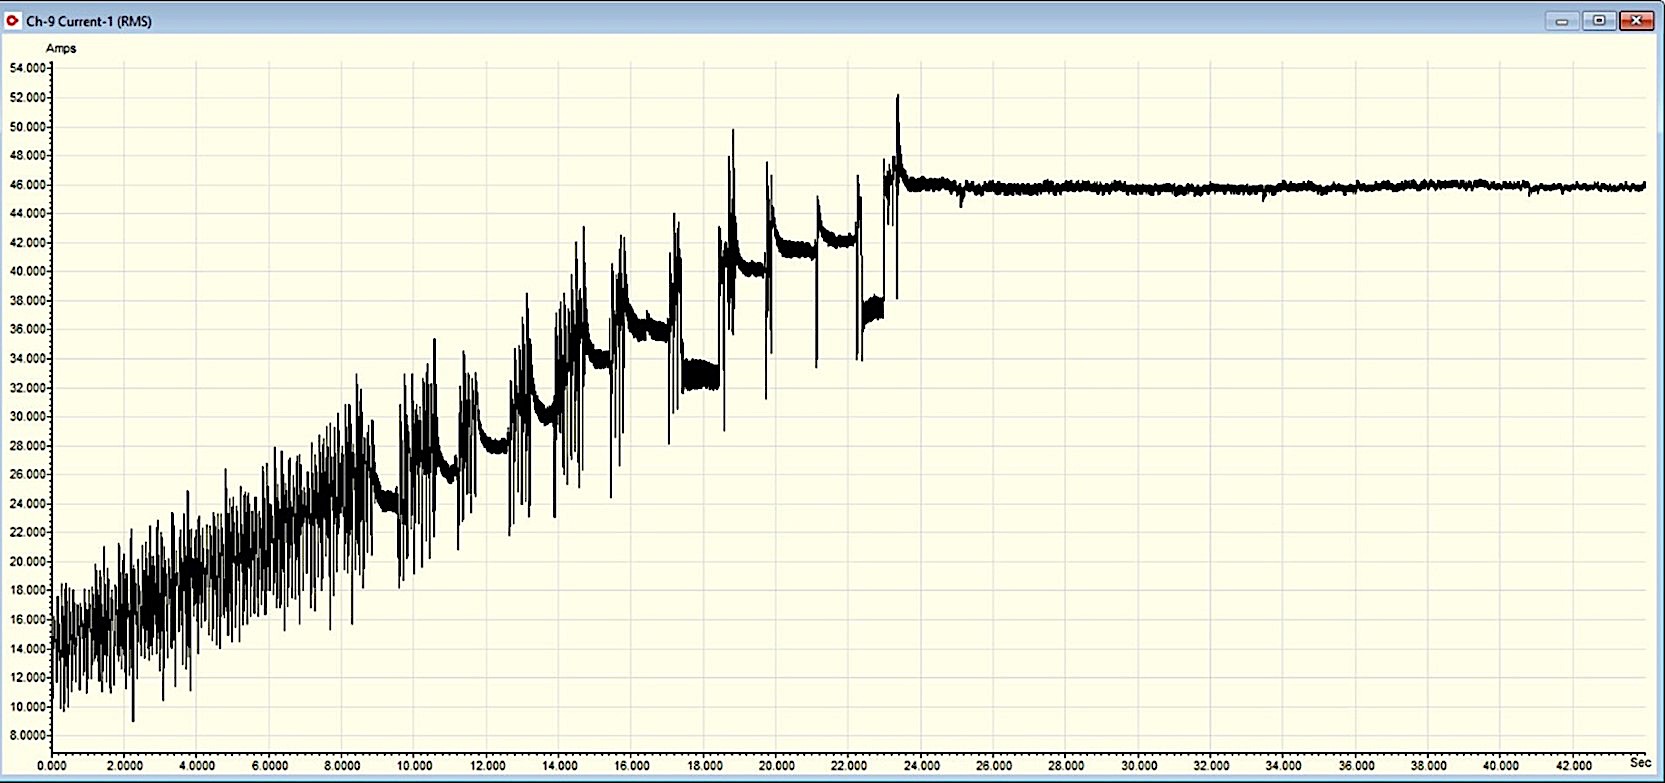
Fig. 2. Inrush pattern on a soft-start, at no load on a repair shop test bed.
Once the motor was up to speed, the real-time current signature was reviewed and then recorded with the Fig. 3 results in the low-frequency spectra.
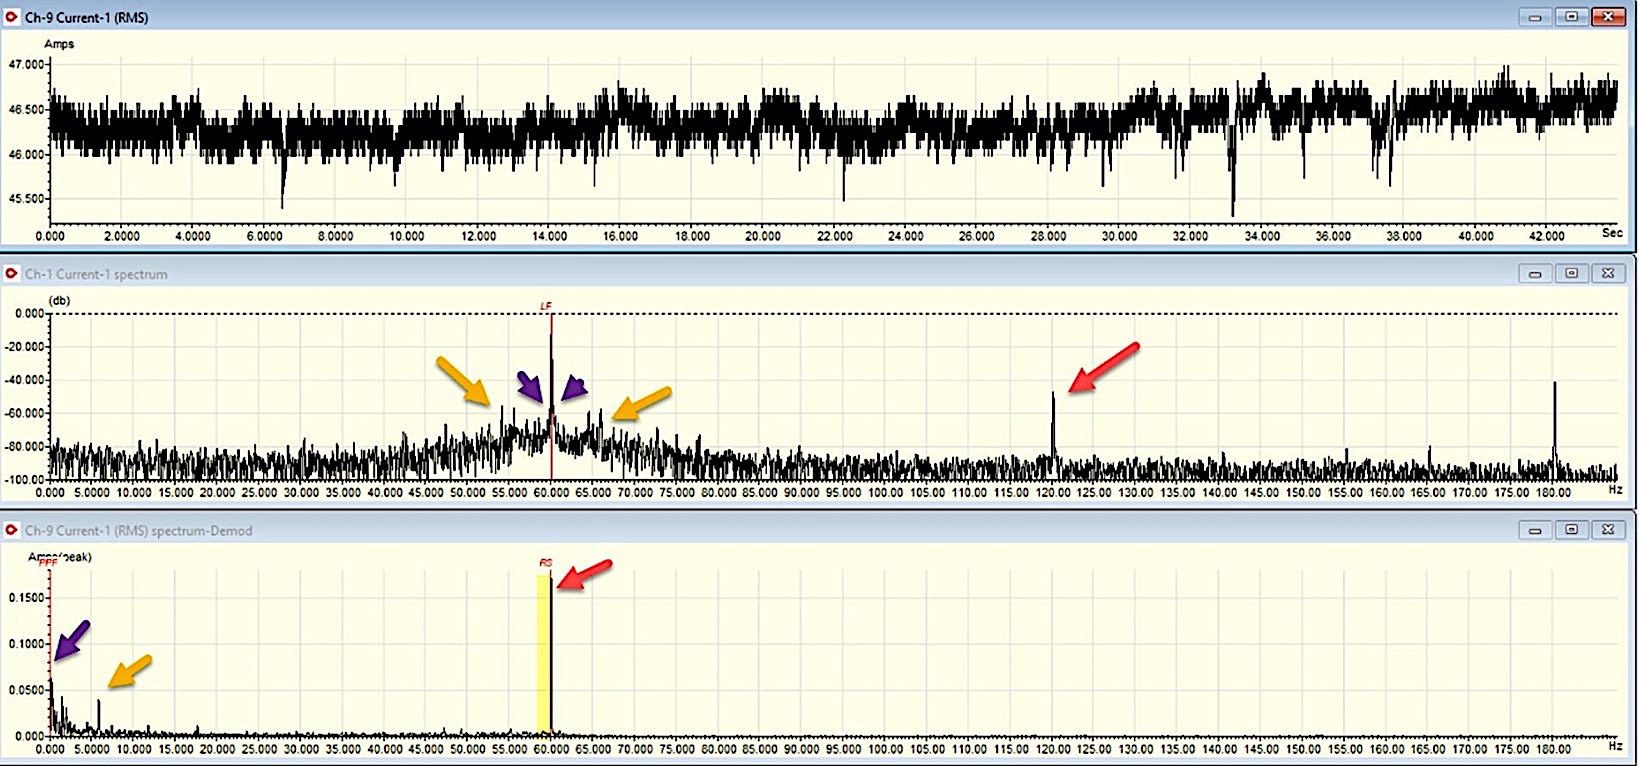
Fig. 3. Low-frequency spectra showing RMS current, line-frequency spectra,
and running speed in demodulated current.
The red peak in Fig. 3 is the speed, which has a very high peak the may indicate some type of looseness or bent shaft in this motor, or even unbalance. Looking to the far left, we see peaks around the purple and gold arrows. The gold arrows relate to the cooling fans on the shaft, which will often show at similar frequencies and may relate to a blade-pass frequency in high-frequency data.
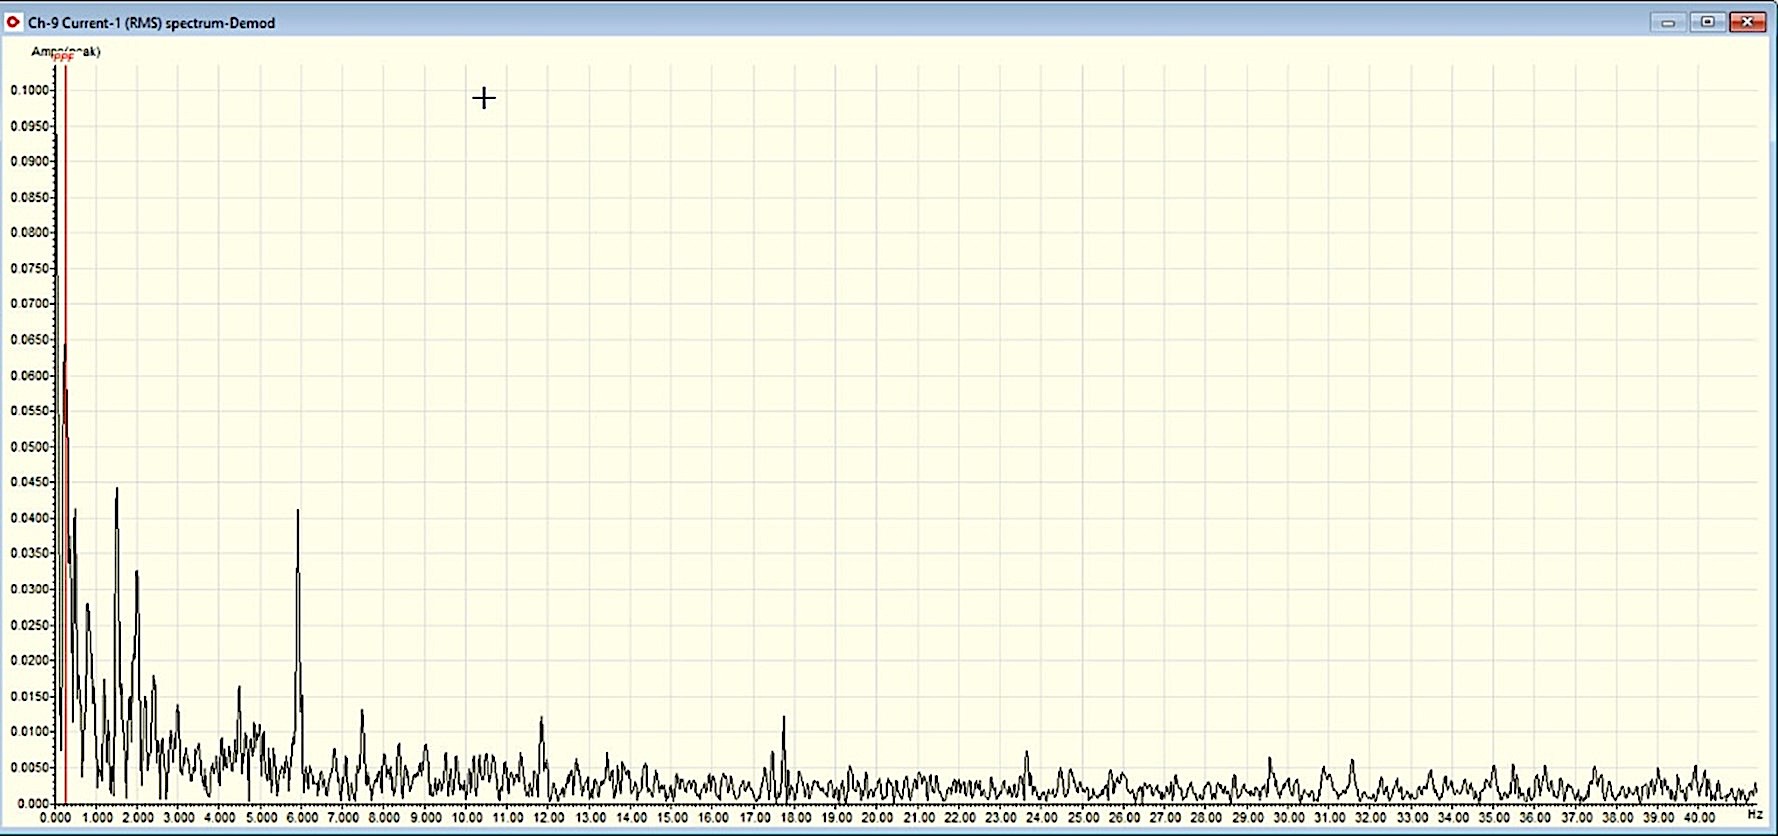
Fig. 4. Demodulated spectra showing a few peaks on the far left associated with pole-pass frequency.
Because we are at near synchronous speed (3600 RPM) without anything loading the shaft, the pole pass frequency can be found all the way to the left, as shown in Figure 4 (red line to the extreme left). This fits with the 1X running peak shown in Figure 3.
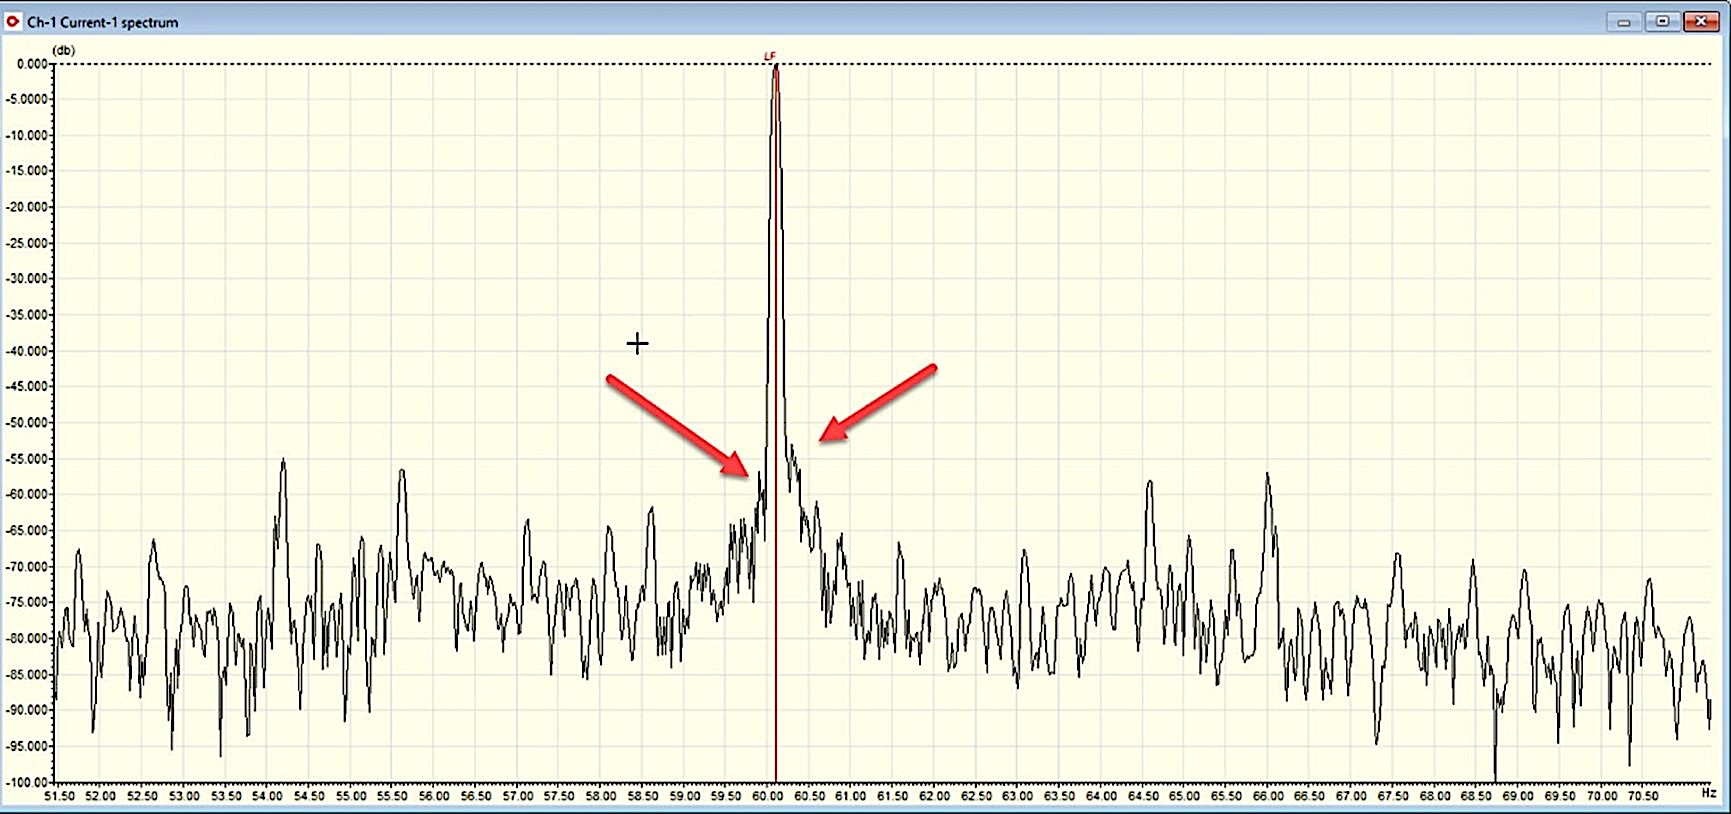
Fig. 5. Low-frequency spectra zoomed close to line frequency to verify pole-pass frequency.
While the values are only about -52dB, there are PPF sidebands around the line frequency, indicating high-resistant joints or fractures (Fig. 5). The RMS current appears as shown in Fig. 6, and with the rattle during startup, coupled with the increased vibration, indicates that there are possibly some loose rotor bars.
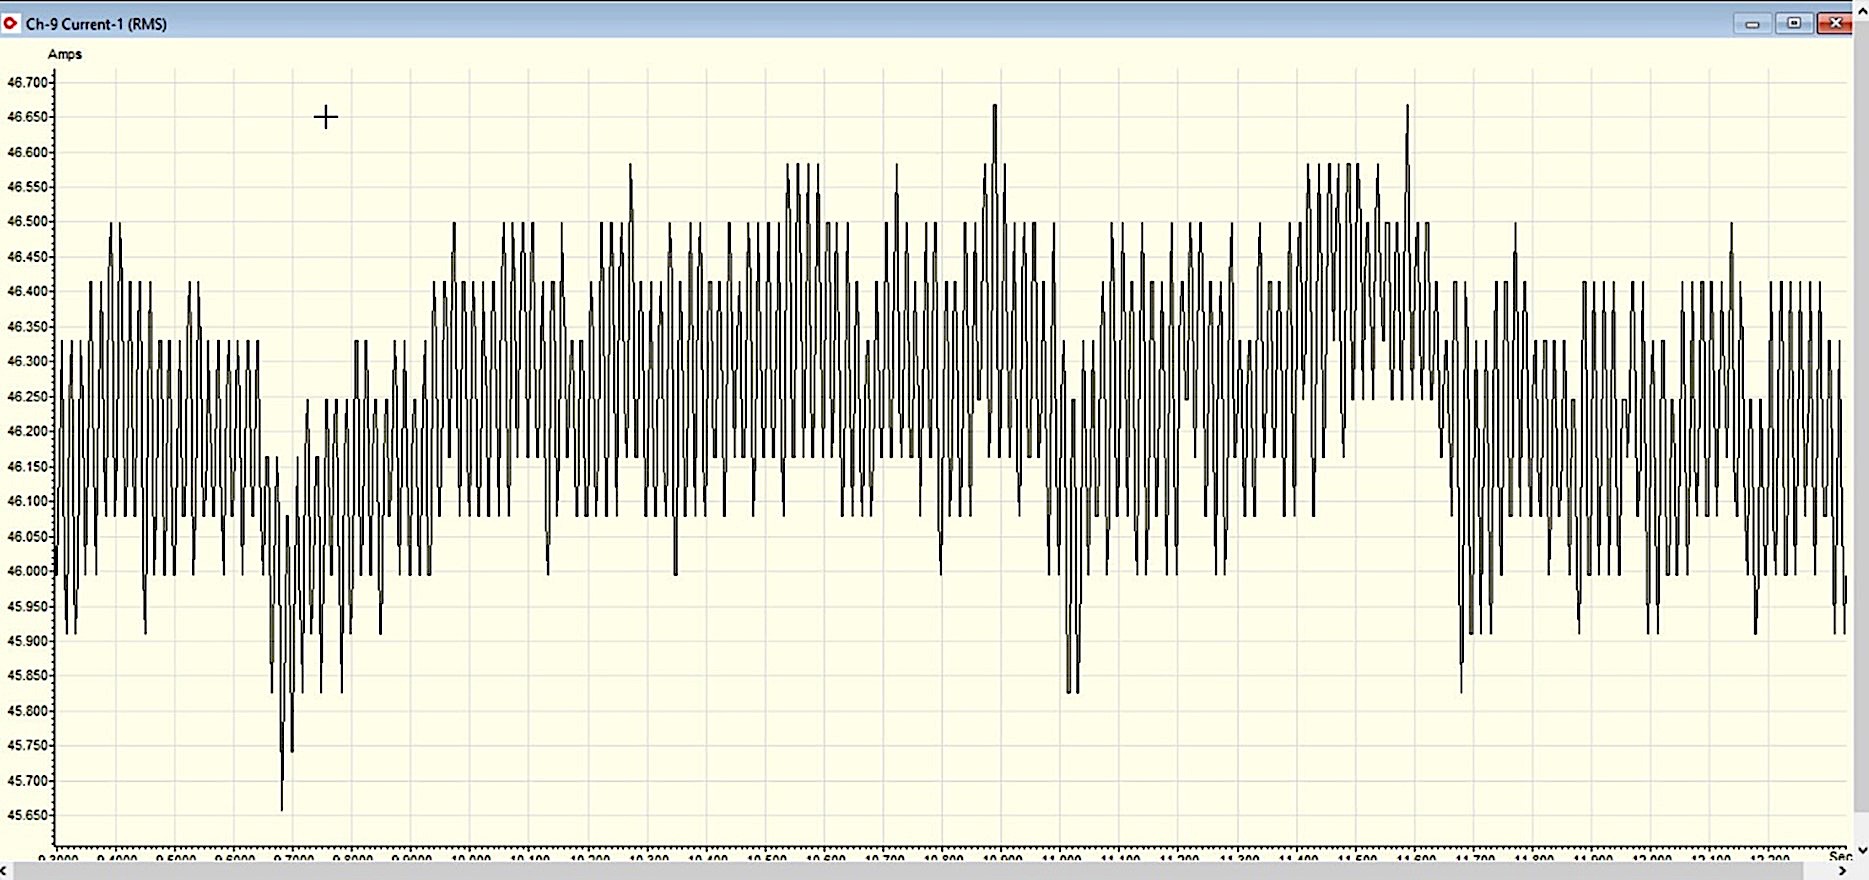
Fig. 6. RMS current.
The RMS peaks have both low- and high-frequency components. This means we need to review the higher-frequency spectrum to evaluate the airgap stator and rotor components.
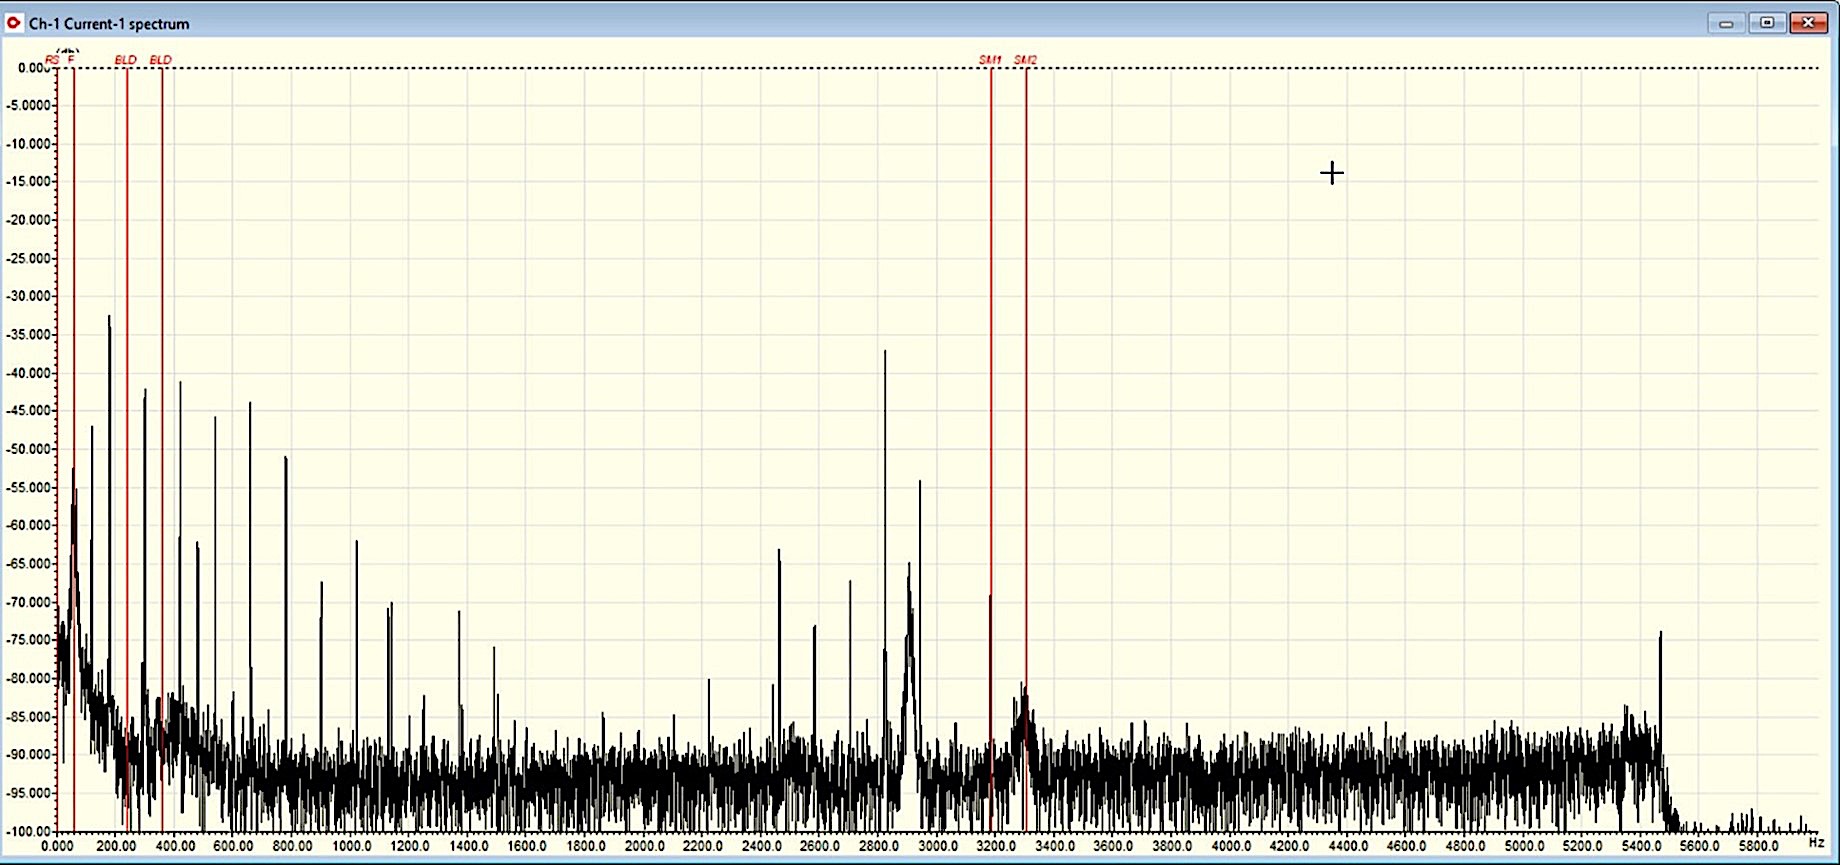
Fig. 7. High-frequency spectra with red lines indicating stator-slot frequencies.
There are peaks associated with 3600 rpm * 54 Stator Slots with +/- line frequency (red SM1 and SM2 lines in Fig. 7). Those peaks indicate coil or stator-core movement, with raised peaks around one of them. This points to the possibility of a loose or cocked stator core.
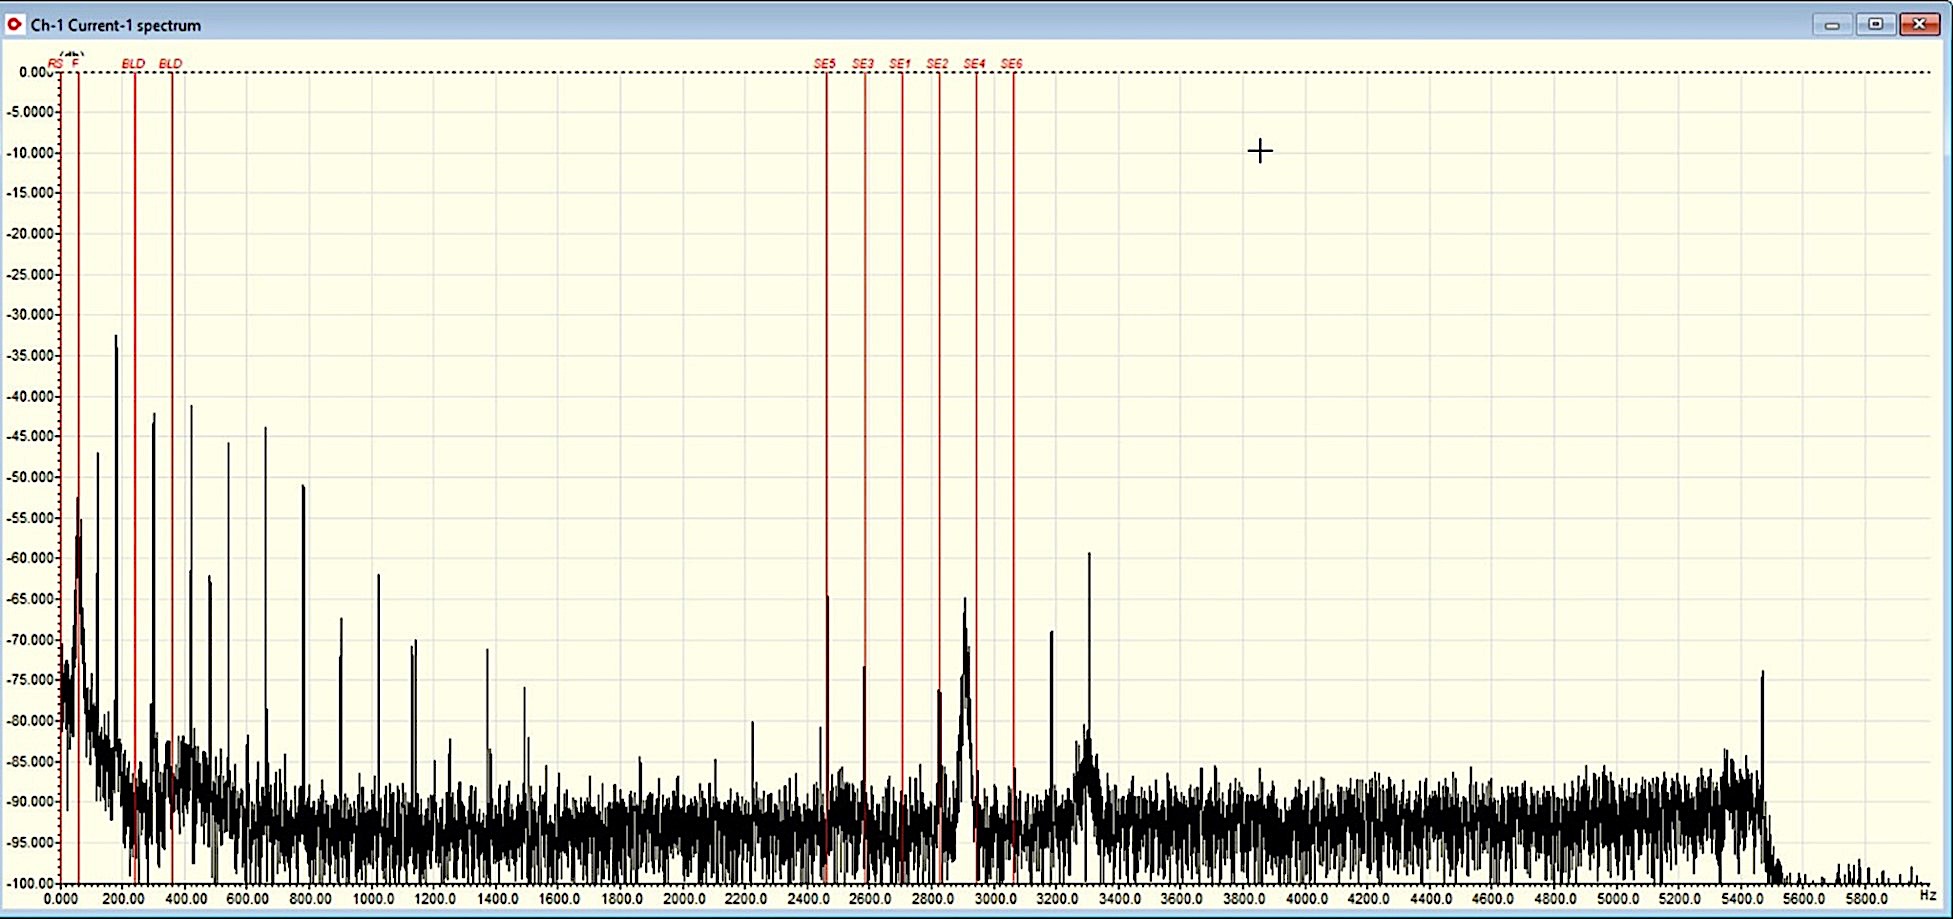
Fig. 8. High-frequency data with static-eccentricity peaks (SE) and blade pass (BLD) low-level peaks.
The stator mechanical signature, coupled with the rpm * 46 Rotor Bars +/- multiple line frequency peaks (see red lines marked SE in Fig. 8), indicate static eccentricity, which supports the cocked or moving stator. It can also indicate that the rotor is mounted off-center in the air gap. A review of the air gap details indicate that the rotor core and stator cores are concentric when de-energized. Also, there is, at least, one peak that has a raised noise floor, which coincides with the stator-mechanical raised noise floor. This indicates looseness.
A large number of broken bars or a bent shaft would have resulted in running-speed peaks around the static-eccentricity peaks (dynamic eccentricity). However, we do not see significant peaks in this area, which would indicate either mechanical or electrical-related airgap-magnetic- field orbiting. The small values would coincide with loose bars moving outward, due to centrifugal force.
USING MCSA AS DESCRIBED HERE
To perform the level of analysis discussed here, a higher resolution is required. In the case of our 900-hp motor, 65,500 lines per inch are used to separate running speed and harmonic peaks. With many ESA/MCSA devices using an average range of ~15k lines per inch, a higher load is required to generate enough slip to identify pole pass frequency and separate the peaks shown in this article. This is often identified as 50% load. With higher-resolution test devices, the loads can be much lower since, unlike vibration, the primary issue is to cause a reduction in speed (slip). In cases where the peaks are still close, the voltage may be reduced on the test bench in order to cause the speed to reduce and the peaks to show. With vibration, you often require the higher load to increase vibration energy of these types of defects to a detectible level.TRR
Click On The Following Links for Previous Articles In This Electric-Motor Reliability Series
March 28, 2020: “What The Studies Really Said”
April 12, 2020: “Comparing What The Studies Said”
April 18, 2020: “How The Studies Applied to Larger Motors”
May 2, 2020: “A Data Mind-Bender”
May 29, 2020: “Site and Study Findings Compared”
June 13, 2020: “Developing Testing Programs”
June 19, 2020, “High-Voltage Testing”
July 3, 2020: “Testing with Ohm Meters”
July 10, 2020: “Best Practice to Insulation to Ground Testing Methods”
July 25, 2020: “Annex D in IEEE 43-2013
August 7, 2020: “Advanced Insulation Systems & Hi-Pot Testing”
August 22, 2020: “What Makes Electrical Signature Analysis Different?”
August 28, 2020: “ESA, MCSA, Rotor Bars, Shaft Fault and Bearing Wear“
Sept. 4, 2020: “Trending Rotor Bar Failures (Case Study)”
Sept. 11, 2020: “Electrical Signature Analysis and Pumps”
Sept. 17, 2020: “Electrical Signature Analysis (ESA) & Fan Belt Applications
ABOUT THE AUTHOR
Howard Penrose, Ph.D., CMRP, is Founder and President of Motor Doc LLC, Lombard, IL and, among other things, a Past Chair of the Society for Reliability and Maintenance Professionals, Atlanta (smrp.org). Email him at howard@motordoc.com, or info@motordoc.com, and/or visit motordoc.com.
Tags: motors, drives, motor testing, reliability, availability, maintenance, RAM, motor current signature analysis, MCSA, electrical signature analysis, ESA

