
In this week’s article on Electrical Signature Analysis (ESA), we discuss the issue of a 1X rpm current reading when dealing with belted applications. For this example, the motor is a 15 hp, 1765 rpm, 460 Vac, 18 Amp unit with 40 rotor bars (RB) and 48 stator slots (SS). The measurements related to the sheaves are 3.5-inch motor (driver) and 9.148-inch fan (driven) with a center-to-center length of 25.5 inches between the two shafts.
As noted in Fig. 1, the 1X rpm signature of the motor is relatively low. However, there are a few peaks that are higher. As these surround the line frequency, they are most likely associated with the motor shaft or driven equipment. In this case, we are dealing with sheaves and a fan, so we can calculate a few frequencies that will help us understand what we are looking at with the information below (Fig. 1).
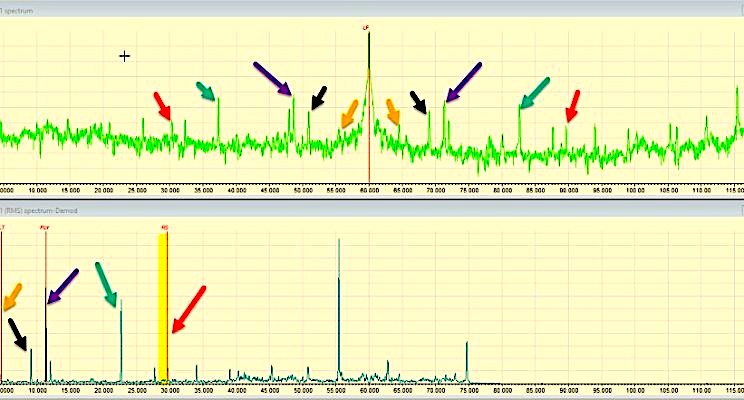
Fig. 1. Low-frequency signatures on a belted application.
Using the 1X rpm peak between 1765 rpm and 1800 rpm, as we know that the motor current is 13.5 Amps (Fig. 2), and we are at 60Hz, we have a speed of 1779.8 rpm, or 29.663Hz. By looking at the sheave (pulley) ratio from the driven equipment, we have ((3.5in/9.148in)*29.663Hz =) 11.349Hz, or 680.9 rpm, which are almost exactly the peak of 11.353Hz in Fig. 1 (purple arrow), which also appears to have a harmonic at the blue arrow. Since the 1X rpm could indicate an unbalance in the fan, let’s investigate.
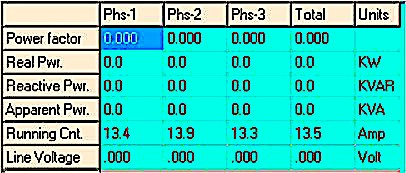
Fig. 2. Data showing only current collected.
With a little more work we can calculate the belt speed. This is completed by calculating the belt length and conveyor speed, then using that information to calculate the belt frequency.
The belt length is calculated by ((center to center * 2) + 0.5*((diameter of driver times pi) + (diameter of driven times pi))), or ((25.5in * 2) + (0.5 *((3.5in*pi) + (9.145in*pi)))) = 70.86in.
The conveyor speed (how fast the belt is traveling) is calculated from either pulley, but usually the driver. In this case it is the running speed (Hz) * 2pi * radius of the sheave = 29.663Hz * 2pi * 1.75in = 326.16Hz-in.
The belt frequency is then calculated as the conveyor speed divided by the belt length, or (326.16Hz-in/70.86in = ) 4.603Hz. As shown in Fig. 1, there is a peak (gold arrow) with a corresponding harmonic (black arrow).
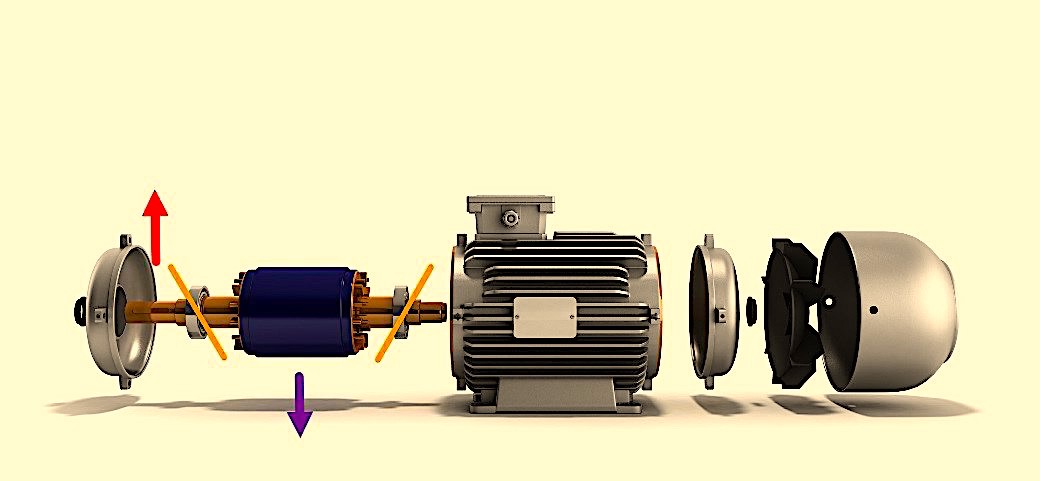
Fig. 3. Expanded motor showing where forces occur on over-tensioned shafts.
Experience has shown us that when we see harmonics of the fan and belt, there is either a misalignment of the sheaves or severe wear. Moreover, the belt could be too tight. Since the bearings act as a pivot point for the shaft, if the belt is tight, it will be pulled in the direction of the fan, causing the rotor to bow to one side of the stator airgap (as shown in Fig. 3). This will result in a static eccentricity.
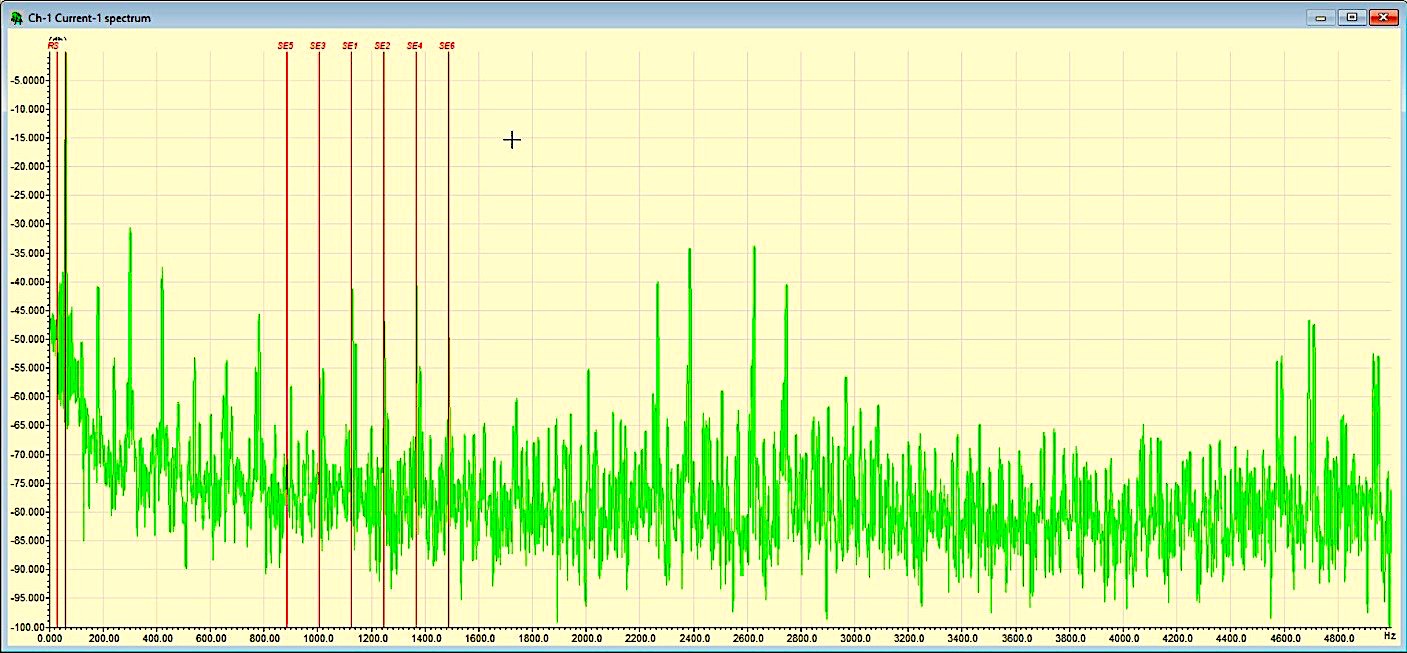
Fig. 4. High-frequency FFT analysis of a fan-and-belt application
showing static eccentricity, which points to over-tensioned belts.
With regard to the fan-belt example discussed in this article, Fig. 4 (above) does indeed show a static eccentricity. Thus, we can be confident that the belt is probably too tight, which is a very common issue.TRR
Click On The Following Links for Previous Articles In This Electric-Motor Reliability Series
March 28, 2020: “What The Studies Really Said”
April 12, 2020: “Comparing What The Studies Said”
April 18, 2020: “How The Studies Applied to Larger Motors”
May 2, 2020: “A Data Mind-Bender”
May 29, 2020: “Site and Study Findings Compared”
June 13, 2020: “Developing Testing Programs”
June 19, 2020, “High-Voltage Testing”
July 3, 2020: “Testing with Ohm Meters”
July 10, 2020: “Best Practice to Insulation to Ground Testing Methods”
July 25, 2020: “Annex D in IEEE 43-2013
August 7, 2020: “Advanced Insulation Systems & Hi-Pot Testing”
August 22, 2020: “What Makes Electrical Signature Analysis Different?”
August 28, 2020: “ESA, MCSA, Rotor Bars, Shaft Fault and Bearing Wear“
Sept. 4, 2020: “Trending Rotor Bar Failures (Case Study)”
Sept. 11, 2020: “Electrical Signature Analysis and Pumps”
ABOUT THE AUTHOR
Howard Penrose, Ph.D., CMRP, is Founder and President of Motor Doc LLC, Lombard, IL and, among other things, a Past Chair of the Society for Reliability and Maintenance Professionals, Atlanta (smrp.org). Email him at howard@motordoc.com, or info@motordoc.com, and/or visit motordoc.com.
Tags: motors, drives, motor testing, fans, belted equipment, fan belts, reliability, availability, maintenance, RAM, electrical signature analysis, ESA

