Material wear is a primary cause of degradation of electric machines and driven equipment or powertrain. Wear is caused by either normal operation or abnormal conditions and is also dependent upon the type of equipment and application. The impact of wear in electric machines and related powertrain has a significant effect on the reliability of the systems related to the electric machines. Through detection of the wear, risk assessment can be performed along with a related time to failure estimation through technologies such as Electrical Signature Analysis (ESA) and, for electric motors, Motor Current Signature Analysis (MCSA).
With the primary method of reliability issues being intrusive maintenance, the ability to evaluate the condition of machine, and related machine powertrain wear, is crucial. Two of the technologies that allows the engineer or technician to evaluate the condition of a machine un-intrusively is ESA and MCSA. ESA was originally developed by Oak Ridge National Laboratories (ORNL) to provide an improved method of determining the condition of Motor-Operated-Valves (MOVs) in safety conditions of nuclear power plants. MCSA has a variety of sources with the more accepted development related to the University of Edenborough for testing off-shore drilling rig electric motors. The development of both technologies trace back to the late 1970s and 1980s with commercial application around 1990.
The technology has advanced significantly since the 1980s as it has been applied to additional electrical machine types including electric motors of all types and generators of all types. The gathered experience has also identified the capability of ESA and MCSA in the detection of powertrain-related wear. MCSA can often be found in some vibration-data-collection systems, while ESA requires the capabilities of a power analyzer.
The primary differences between ESA and MCSA include:
♦ MCSA will provide insight on electric motor and driven-equipment issues only. It has the ability of supporting technologies, such as vibration analysis, in confirming electrical-related wear and similar faults as those found by vibration. However, when used, a fault detected in a machine may actually be related to other machines on the same transformer branch.
♦ ESA provides the ability to look at both supply and load, as well as determine if a fault is from the machine being tested or from a machine elsewhere in the transformer branch. Voltage Signature Analysis is used to detect issues upstream of the point of test while Current Signature Analysis is used to detect issues downstream of the point of test.
♦ ESA provides the ability to review torque related to the air-gap of the machine. This allows the user to observe torsional issues driven by the power supply.
♦ ESA provides the ability to evaluate the power quality of the system.
Through the rest of this article we will use the term ‘ESA’ for evaluating electrical machine system wear and the term electrical machine to relate to both electric motors and generators. Also, as we proceed through the discussion of how analysis is performed, the signatures are the same if we are looking at current signatures for motor-systems and voltage signatures for generator-systems.
PRINCIPLE OF OPERATION
Modern data-collectors have replaced the experimental equipment of the 1980s and a variety of ESA and MCSA devices are readily available. The type of data collected includes RMS voltage and current and the instantaneous fluctuations of voltage and current. The RMS signals provide a view of load over time and the instantaneous data is converted via Fast Fourier Transform (FFT) in order to provide a review of amplitude and frequency.
With most external technologies, such as vibration analysis, the transducer is external from the machine and picks up data related to the movement of the components, or discharges through components. With ESA, the transducer is the airgap of the machine with voltage clips and current clamps collecting the data. Movement of the rotor within the airgap, or the area between the stator and rotor, causes variations in the magnetic field and, as a result, the current. The rotor movement is very slight, however, the variation in current and relative force can be significant enough because of the inverse square law of fields.
The data collectors for ESA measurements are variations of power analyzers, which have the resolution and accuracy to produce the needed data and fluctuations in the voltage or current waveforms. This provides the addition of power analysis to the capability of ESA devices for troubleshooting a system, which may not be available in MCSA-only capable instruments.
Defects in the powertrain will also cause the side to side movement of the rotor and the stator frame/core, providing the ability to evaluate the condition of components outside of the electric machine. With the addition of torsional analysis by several commercial ESA devices the effects of either the electric machine controls or driven load can be determined.
Data is determined by viewing either the peak voltage or current and counting down from the peak in dB such that the relative force on the fault, or peaks, can be related to the peak voltage or current. This is often referred to -dB, or dB down, and is, unlike other technologies such as vibration analysis, relatively unaffected by load. This provides an ability to trend electrical machine and drivetrain wear over time without having to duplicate the operating conditions.
EVALUATION OF BROKEN ROTOR BARS
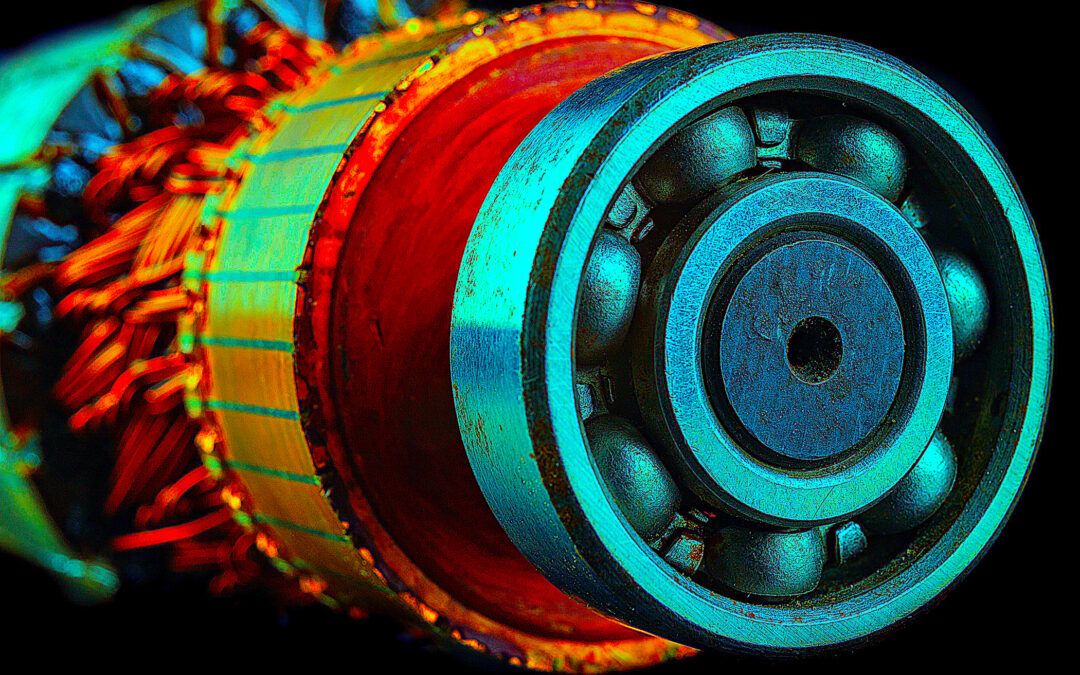
The most publicized capability of ESA is the detection of broken rotor bars (see Fig. 1). Normally a fault in larger induction motors that use copper or aluminum alloy bars, as opposed to smaller machines with cast aluminum, or copper, bars, broken rotor bars are the result of wear and embrittlement of the materials that’s often caused by too many starts or significant fluctuations in load. As the rotor changes speed, it generates heat and requires a period of time to cool down. On larger and high inertia machines and loads, the amount of heat can be significant and cooling times longer which translates into fewer starts per time as electric motors become larger.
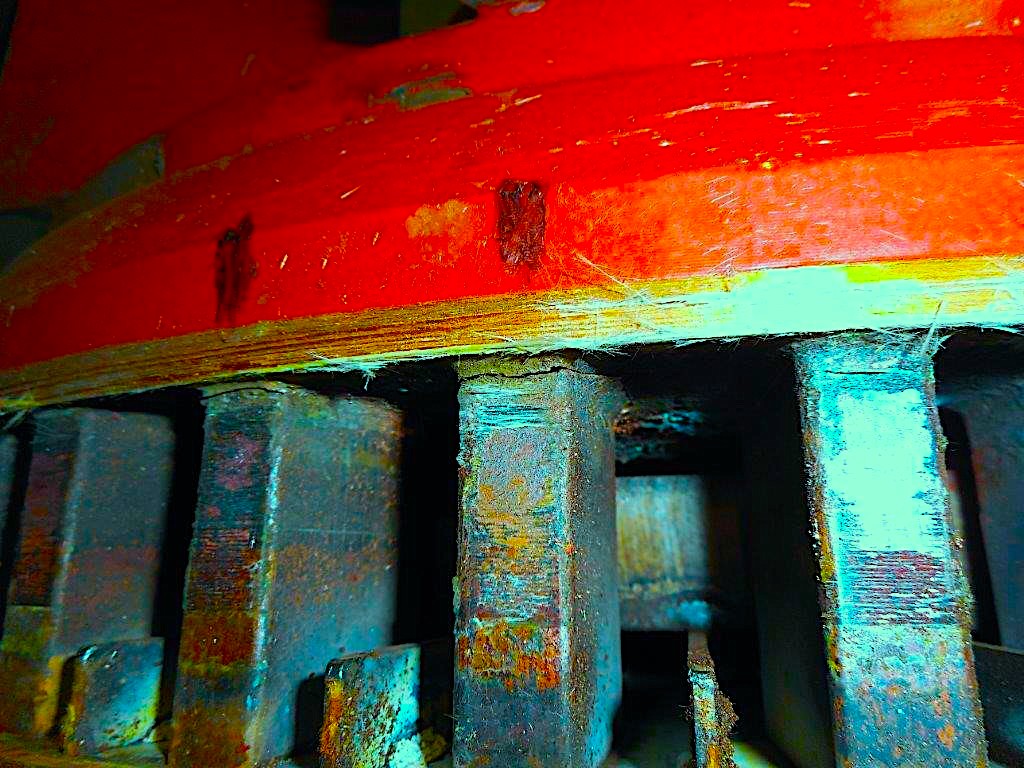
Fig. 1. Broken rotor bars
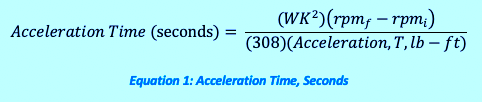
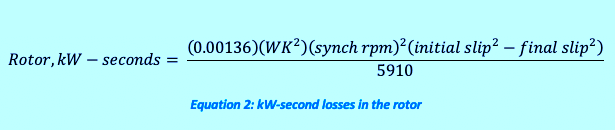
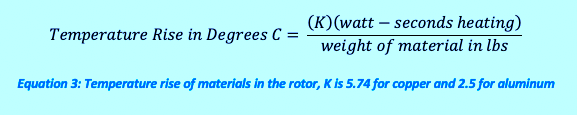
Referring to Equations 1, 2, and 3 below, note that a machine will accelerate based upon the inertia of the motor and load. In the process, it produces losses in the form of kW-seconds, which can be translated to a temperature rise in the copper or aluminum bars.
 \
\ 
In larger medium-voltage and specialty machines, where the bars extend beyond the rotor core, constant changes in heating and cooling, as well as excessive heating from extended or too many starts, will embrittle the material. As the inertia of the rotor core and the shorting rings that connect the bars on these machines are different, there is a bending and flexing of the bars on each start as they exit the core and enter the rings. Once cracked, the current no longer flows through the rotor bar and the magnetic fields pass through the point without resistance causing a variation in the magnetic field current as the spot passes each pole. This is referred to as the ‘Pole Pass Frequency’ or PPF.
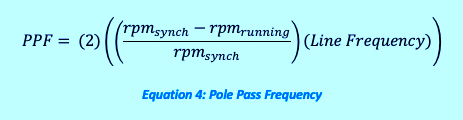
The PPF is calculated as twice the slip frequency, which is simply calculated as shown in Equation 4.
It was discovered that when there are multiple broken rotor bars with good bars between groups of broken ones, they generate harmonics of the PPF. This situation helps in the evaluation of the severity of the broken rotor bars in an induction machine.
Figure 2 shows a typical rotor-bar signature from ESA, or MCSA, on a 4000 hp, 1790 rpm induction motor. The graph on top is the RMS Current, which shows a regular fluctuation that would be seen on an analog current meter. The lowest graph is the ‘demodulated’ spectrum showing a peak at the PPF. The area of importance for detection is on the middle graph where the reference is a 60 Hz current and then sidebands of the current at PPF on both the higher and lower side of the line frequency. The Y-axis is in -dB counted down from the top of the current and there are harmonics of the PPF.
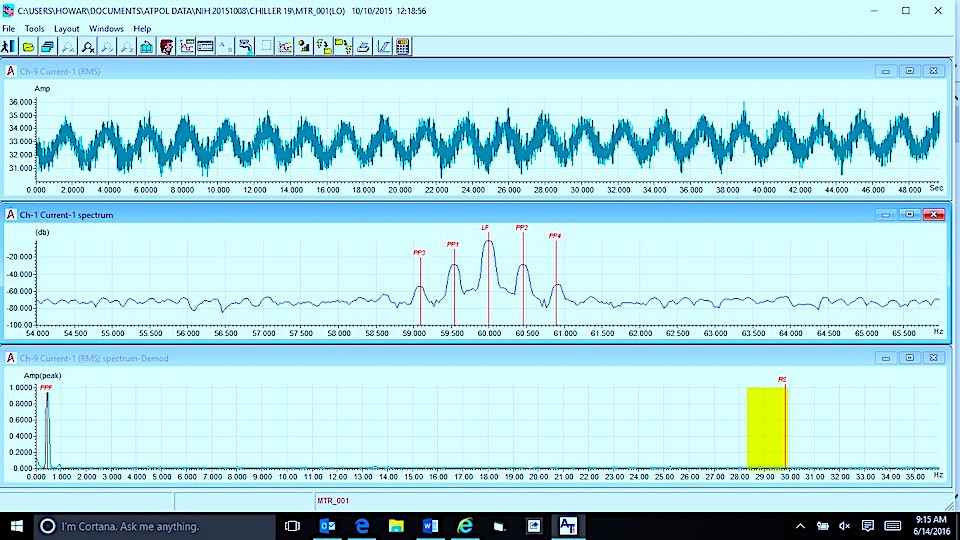
Fig. 2. ESA current signature of motor with broken rotor bars.
EVALUATION OF A BROKEN SHAFT
ESA can be used to evaluate torsional issues on electric machines and help determine if the failure is from the controls, such as Variable Frequency Drives (VFD) or load. For instance, the shaft failure found in Fig. 3 occurred several times in an annealing oven on both 800-hp and 600-hp electric motors. Using normal troubleshooting and vibration techniques, the owner of the machine varied the shaft material, which effected the life slightly. As soon as the atmosphere in the oven exceeded 12 Bar, the shaft, on which a fan was directly mounted, would fail.
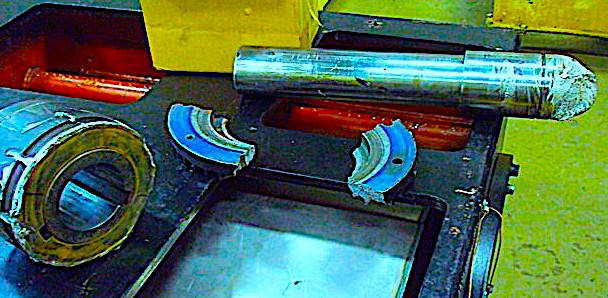
Fig. 3. Broken shaft and fan hub.
ESA was used to evaluate the condition of the machine to balance out the vibration analysis that was being used. As the machine was operating in a severe environment and there were challenges mounting equipment, the application was suited specifically to ESA testing. At 12 Bar the torque ripple had increased significantly, as shown in Fig. 4, and the torque ripple frequency will show as sidebands around line frequency current (voltage in generators).
Figure 5 shows the signature after correction, the new torque ripple has dropped to 14 Hz and is still high, requiring additional research into the fault.
Upon interviewing the owners of the machinery, it was determined that the machine-VFD combination had not been auto-tuned. This was performed and the machine operated properly from that point forward. In general, the torque ripple should not exceed 1% of the total torque of the machine, and the frequency should be relatively low.
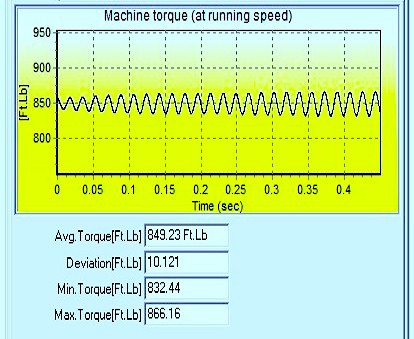
Fig. 4. Torque ripple of 34 ft-lb at ~25 Hz.
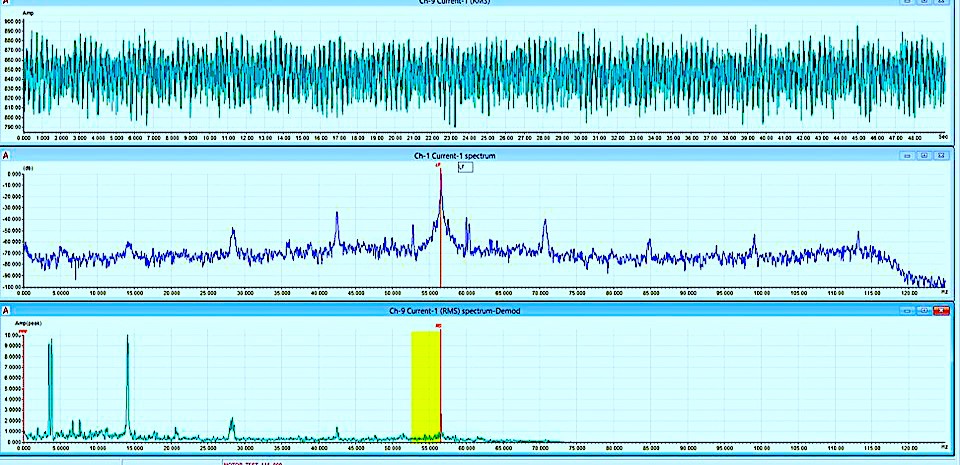
Fig. 5. ESA following cleanup of high-frequency torque The 14 Hz peak is related to the final torque ripple.
BEARING FAULT DETECTION
The detection of faults using ESA requires knowledge of the speed of each shaft associated with the equipment. With this information you can detect virtually any electrical and most mechanical problems including late-stage bearing faults.
Bearings are generally non-integer peaks associated with the speed of each shaft. For instance, if you have a peak pair of 408 Hz and 528 Hz and a speed of 29.9 Hz, then you would have a multiplier as shown in Equation 5.
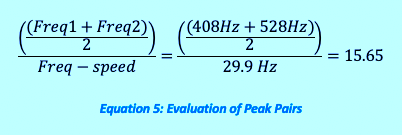
In this case, the result is not an integer of running speed and would most likely be either a bearing frequency or harmonic of a bearing frequency. In ESA and MCSA, bearing frequency peaks will sometimes show up in the 4th or 5th harmonic.
Bearing manufacturers will often provide the multipliers for frequencies associated with the inner race (BPFI), outer race (BPFO), cage (FTF) and ball spin (BSF) of the bearing. So, for instance, if I have a generic 6309 series bearing: BPFI = 4.96; BPFO = 3.037; BSF = 1.95; and, FTF = 0.38, then I would have frequencies as shown in Table 1.
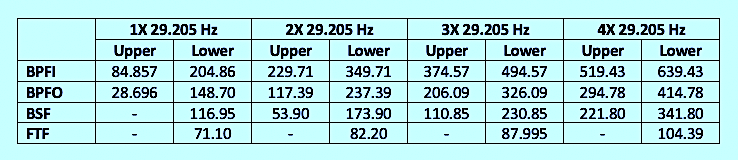
Table I. Bearing Frequencies for 6309 Bearing at 29.205Hz.
To generate movement of the rotor that will allow for early fault detection, the components of the bearings will have to be in a later stage of bearing failure, usually requiring action shortly after any bearing frequencies are detected.
As shown in Fig. 6, there are two non-line-frequency peaks that are 2X line frequency apart. They are 161.08 Hz and 281.08 Hz which results in an average of 221.08 Hz at a speed of 29.205 Hz which results in a multiplier of 7.57. This is a non-integer which makes it most likely a bearing fault. Inspection of the bearing showed that there were issues that needed to be addressed.
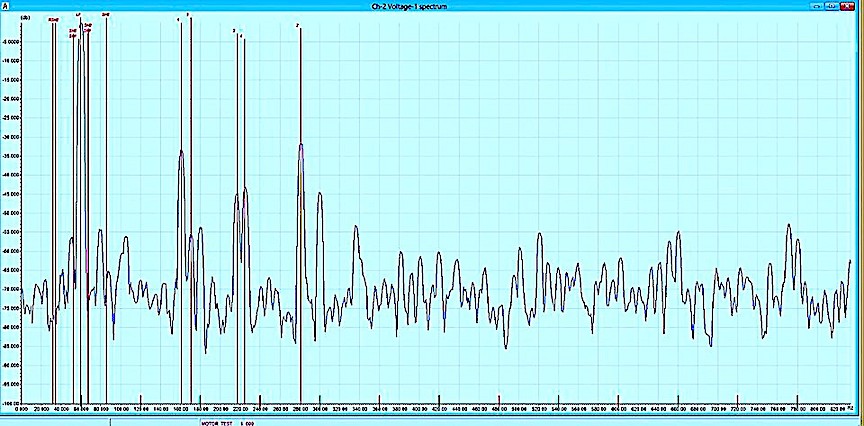
Fig. 6. Bearing faults in generator.
COMING UP
In our next article, we will discuss the progression of a rotor bar fault.TRR
Click On The Following Links for Previous Articles In This Electric-Motor Reliability Series
March 28, 2020: “What The Studies Really Said”
April 12, 2020: “Comparing What The Studies Said”
April 18, 2020: “How The Studies Applied to Larger Motors”
May 2, 2020: “A Data Mind-Bender”
May 29, 2020: “Site and Study Findings Compared”
June 13, 2020: “Developing Testing Programs”
June 19, 2020, “High-Voltage Testing”
July 3, 2020: “Testing with Ohm Meters”
July 10, 2020: “Best Practice to Insulation to Ground Testing Methods”
July 25, 2020: “Annex D in IEEE 43-2013
August 7, 2020: “Advanced Insulation Systems & Hi-Pot Testing”
August 22, 2020: “What Makes Electrical Signature Analysis Different?”
ABOUT THE AUTHOR
Howard Penrose, Ph.D., CMRP, is Founder and President of Motor Doc LLC, Lombard, IL and, among other things, a Past Chair of the Society for Reliability and Maintenance Professionals, Atlanta (smrp.org). Email him at howard@motordoc.com, or info@motordoc.com, and/or visit motordoc.com.
Tags: motors, drives, motor testing, Electrical Signature Analysis, ESA, Motor Current Signature Analysis, MCSA, reliability, availability, maintenance, RAM

