
Rotor-bar failures are not common in properly applied systems. In this short case study, we follow a 4000-hp motor without starting restrictions to rotor bar failure. Lessons learned include demonstration of the fact that load does not impact the relative relationship between peak voltage and current frequencies while trending a fault.
In this application, recommendations to implement time between start limits were regularly by-passed, and the motor was normally restarted multiple times due to driven-equipment deficiencies. Before reading further, though, refer to Fig. 1 for a visual comparison of the four sets of data in the case study.
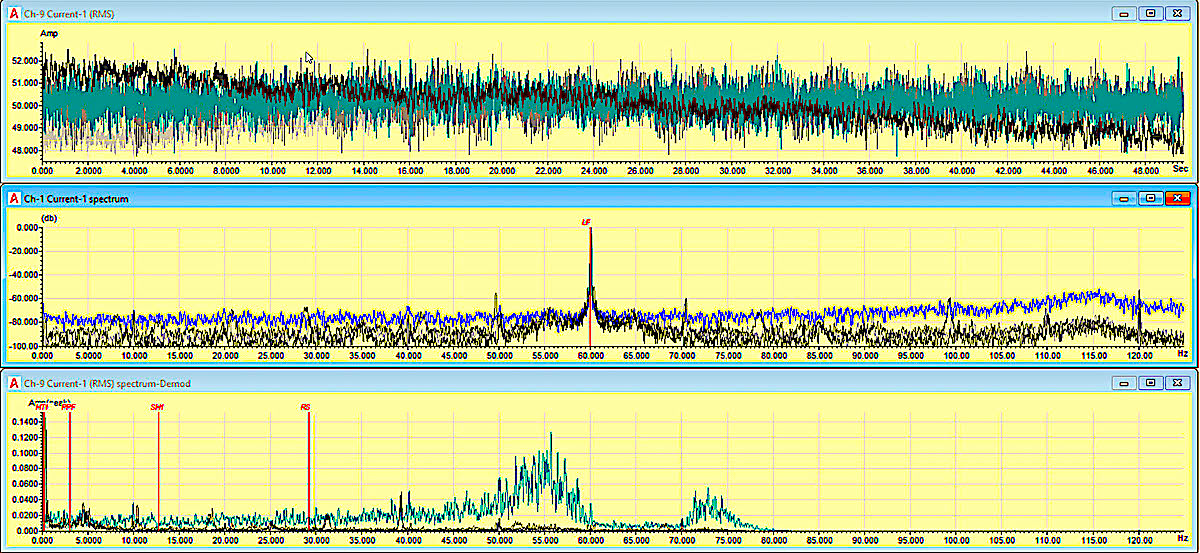
Fig. 1. All four sets of data superimposed for visual comparison.
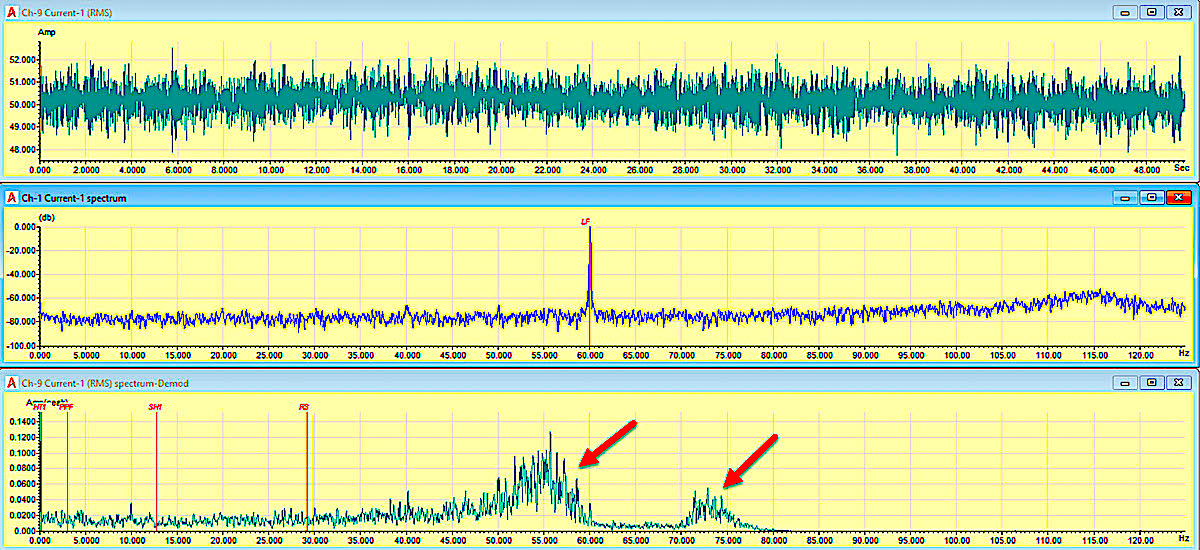
Fig. 2. Baseline low-frequency data: Light load showing cavitation from compressor (January, 2016).
In the baseline data found in Fig. 2, there is no real sign of the rotor bar problem. Due to the light load and almost synchronous rpm, very small PPF peaks can be found on either side of line frequency that are slightly above the noise floor.
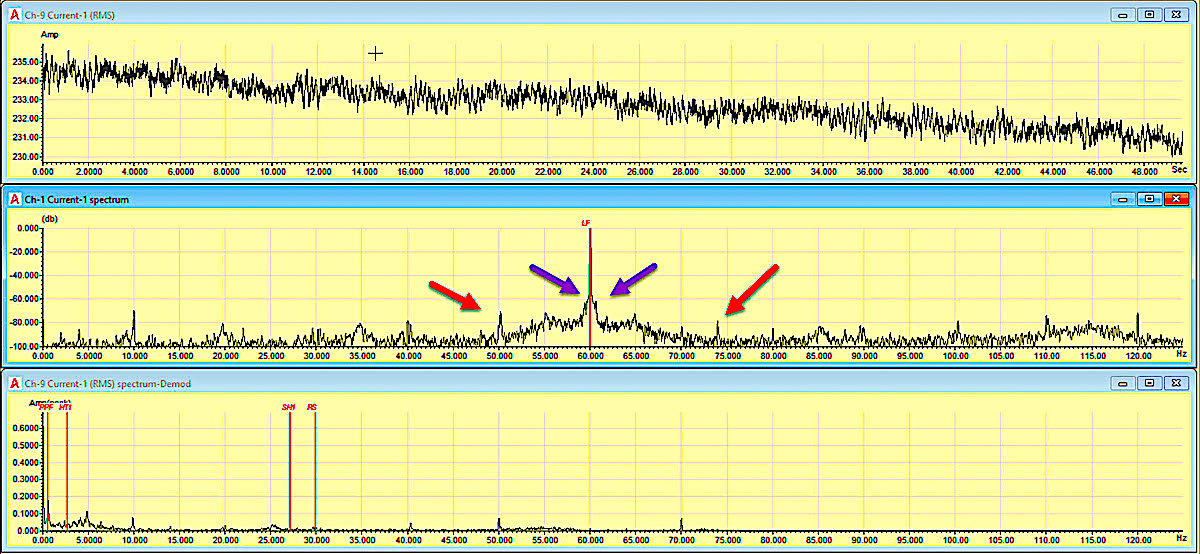
Fig. 3. -62dB down from the peak frequency PPF: Small linear peak in demonstration at PPF,
and gearbox signatures starting to show, due to gear wear (May, 2016).
As noted in Fig. 3, under heavier loading, the gear frequencies (in red) are beginning to show and Pole Pass Frequencies (PPF, in blue), have increased in amplitude to -62 dB. In Fig. 4, there are small dynamic eccentricity peaks, which are affected as the impact of weak fields around fractured and broken bars affect the airgap. There is no indicator in RMS current at this point.
Fig. 4. Dynamic eccentricity increases (May, 2016).
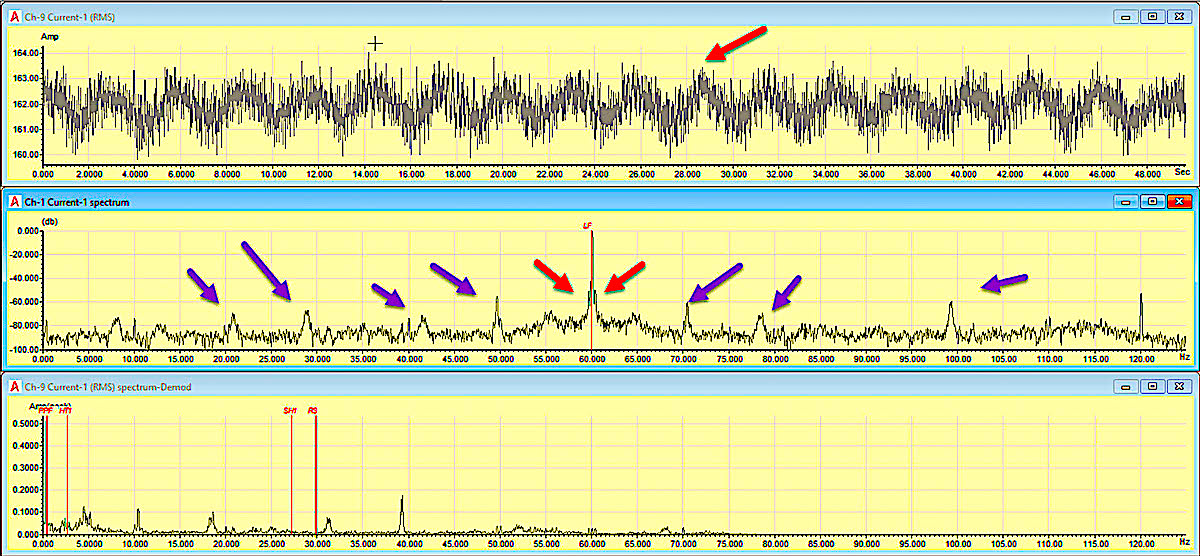
Fig. 5. Lighter load conditions, increased rotor-bar and gearbox frequencies (December, 2016).
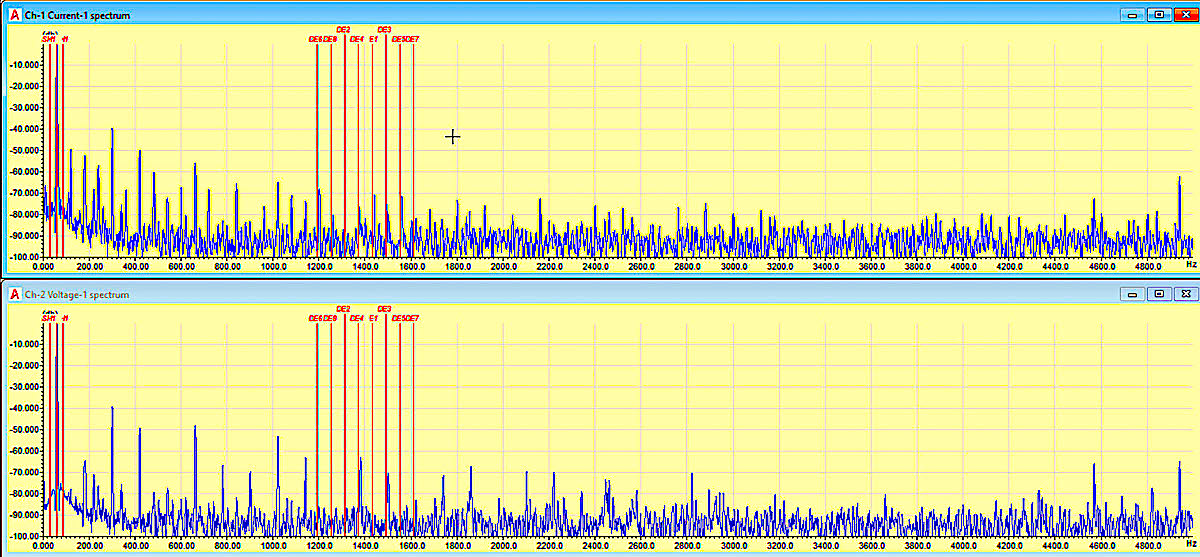
Fig. 6. Increased dynamic-eccentricity peaks (December, 2016).
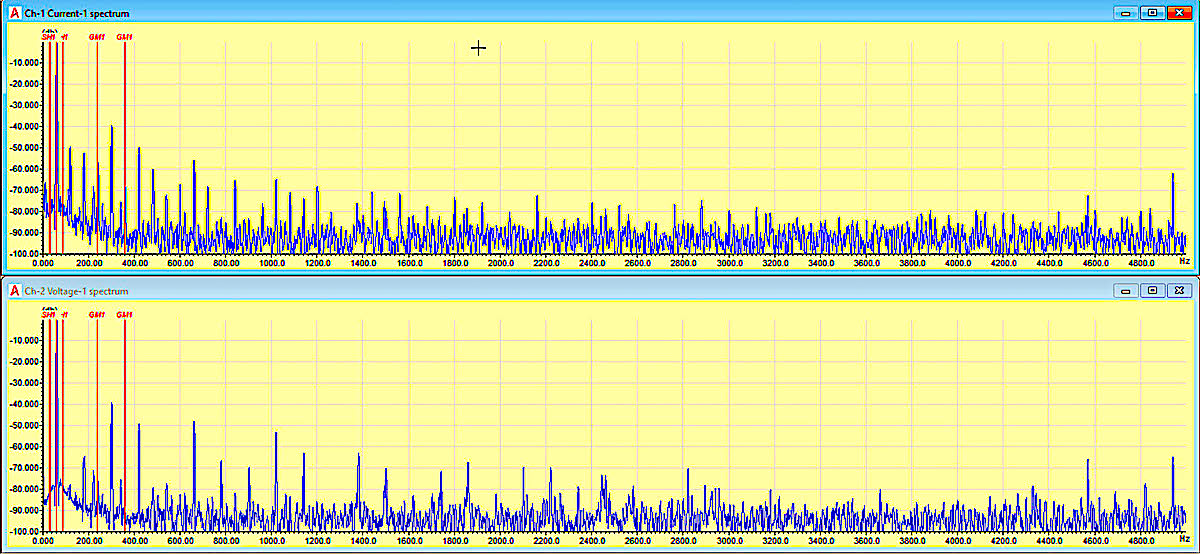
Fig. 7. Gear-mesh frequencies (December, 2016).
In Fig. 5, the PPF frequencies have increased again to -49 dB from the peak (red), and gearbox related peaks have become more numerous and increased. Figure 6 shows increased peaks and dB related to dynamic eccentricity as rotor bar problems become more dominant. While this effect does not always show, it is an indicator of change, and can be used to confirm rotor-bar conditions. As shown in Fig. 7, gear-mesh frequencies are now present as the gearbox wear increases in this application. (Gearbox-bearing signatures are also present, but we’ll leave that issue for another case study.)
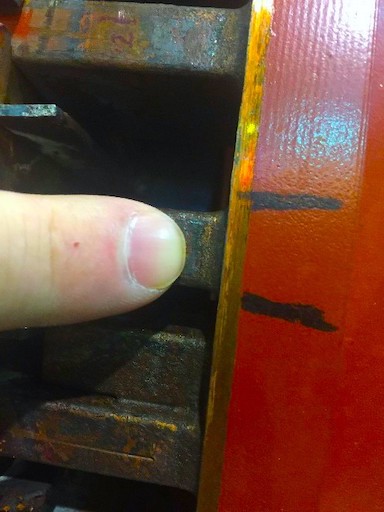
Fig. 8. One of several fractured rotor bars found during shop inspection.
The motor was operated for an additional nine months, until it was removed for rotor-rebar (see Fig. 8 with one of several fractured rotor bars that were found) and general overhaul. Some minor work, limited to availability of parts, was also performed on the gearbox.
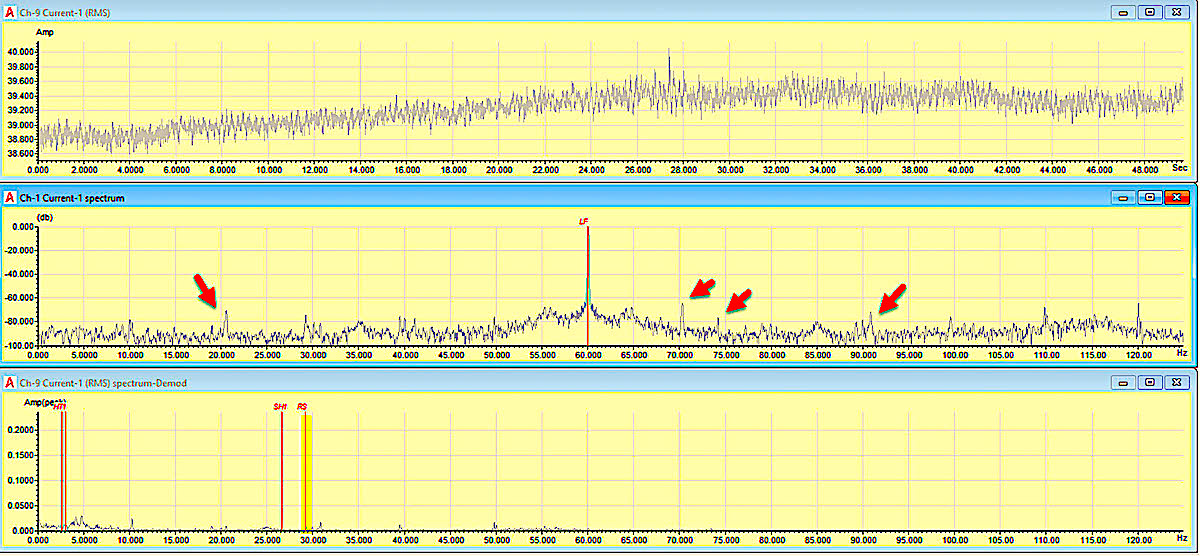
Fig. 9. Following gearbox repair: Presence of gearbox bearing signatures (March, 2018).
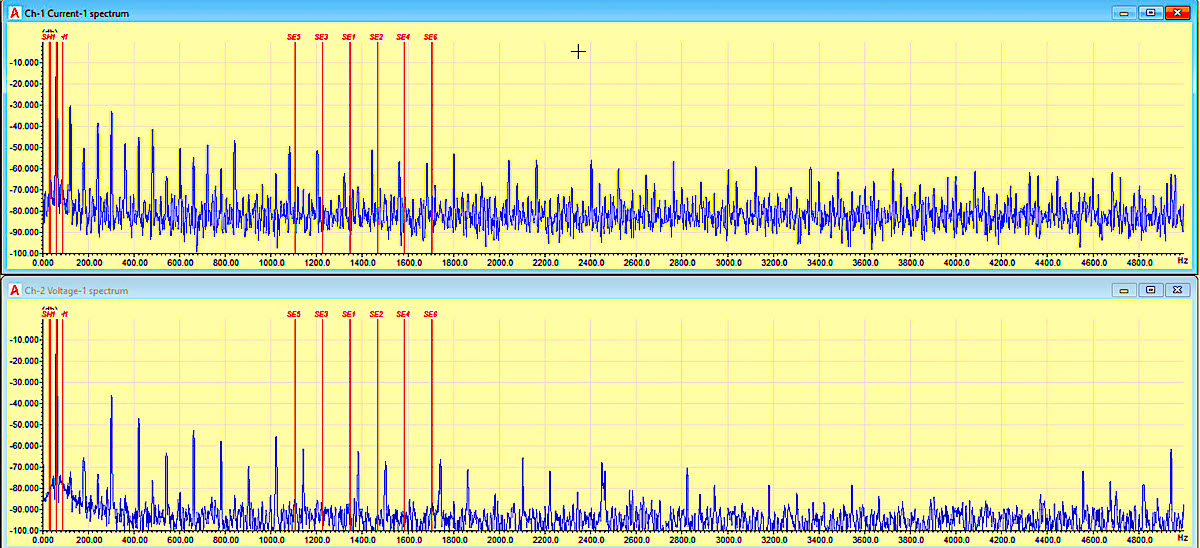
Fig. 10. Following motor repair: Very small levels of static eccentricity (March 2018).
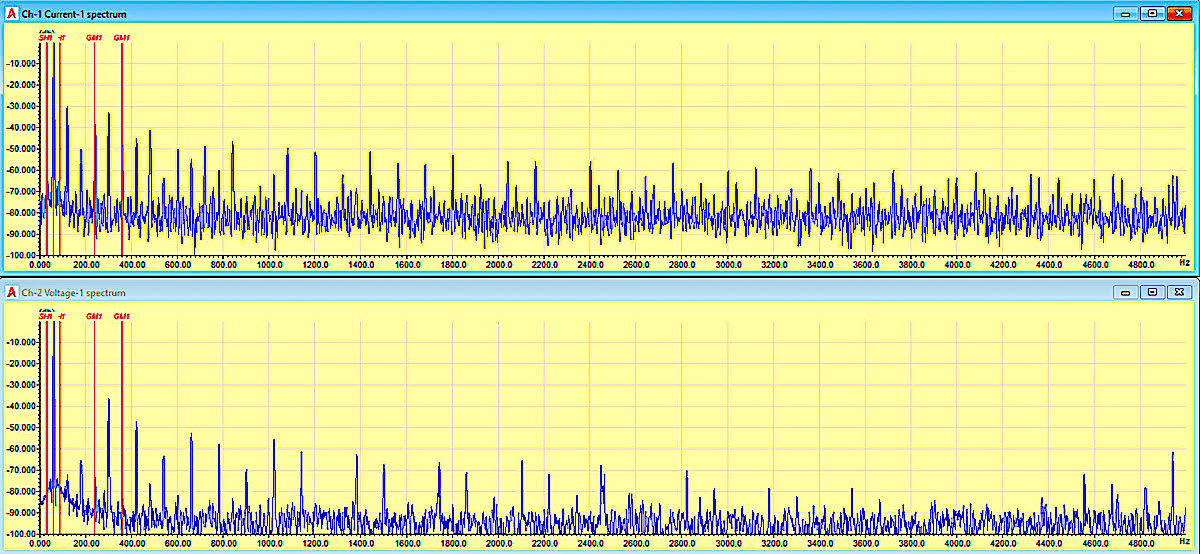
Fig. 11. Following gearbox repair: Gear-mesh frequencies (March 2018).
Figure 9 shows continued indications of the gearbox bearings and gear issues supported by the gear-mesh frequencies indicated in Fig. 11. Very low levels of static eccentricity are found in Fig. 10. These are similar to previous levels, which are indicators of the rotor being slightly off-center in the air gap. Slight misalignment is indicated as the data was taken while the motor was just started and off-set misalignment existed. Subsequent data showed lower 1X rpm peaks (+/- ~30Hz sidebands of 60Hz).TRR
Click On The Following Links for Previous Articles In This Electric-Motor Reliability Series
March 28, 2020: “What The Studies Really Said”
April 12, 2020: “Comparing What The Studies Said”
April 18, 2020: “How The Studies Applied to Larger Motors”
May 2, 2020: “A Data Mind-Bender”
May 29, 2020: “Site and Study Findings Compared”
June 13, 2020: “Developing Testing Programs”
June 19, 2020, “High-Voltage Testing”
July 3, 2020: “Testing with Ohm Meters”
July 10, 2020: “Best Practice to Insulation to Ground Testing Methods”
July 25, 2020: “Annex D in IEEE 43-2013
August 7, 2020: “Advanced Insulation Systems & Hi-Pot Testing”
August 22, 2020: “What Makes Electrical Signature Analysis Different?”
August 28, 2020: “ESA, MCSA, Rotor Bars, Shaft Fault and Bearing Wear“
ABOUT THE AUTHOR
Howard Penrose, Ph.D., CMRP, is Founder and President of Motor Doc LLC, Lombard, IL and, among other things, a Past Chair of the Society for Reliability and Maintenance Professionals, Atlanta (smrp.org). Email him at howard@motordoc.com, or info@motordoc.com, and/or visit motordoc.com.
Tags: motors, drives, motor testing, rotor bars, failure analysis, failure trending, reliability, availability, maintenance, RAM, electrical signature analysis

