
While sometimes referred to as Motor Current Signature Analysis (MCSA), which involves collection of motor current data only, Electrical Signature Analysis (ESA) utilizes both voltage and current data. This includes values, phase impedance, power harmonics, and other information that allows a good look at the condition of electrical and mechanical components upstream and downstream from the motor. In short, ESA provides insight not just on the health of an electrical system, motor, and driven equipment, but goes even further into the process off of a single set of data.
Accordingly, ESA can easily evaluate pump systems, including their cavitation, flow, impellers, even seal issues. And this method can be used whether the motor and pump are directly coupled, the impeller is mounted on the motor shaft, or if you are dealing with unusual belted applications. Just as important, while it can be a bit more complex, the use of ESA is also effective in Variable Frequency Drive (VFD) applications.
In this article, we look at two submersible pumps. The value from ESA technology stretches across all pump sizes and voltages. Our example machines were 30-hp, 1800 rpm, 60 Hz, 460 Vac, 39 Amp pumps, one in distress and one in good condition, tested unloaded. They each had 44 rotor bars and 36 stator slots When performing ESA, knowing the number of rotor bars and stator slots in the tested unit is vita. for accurate analysis, as is, when possible, knowing the number of vanes in the impeller. The applied testing technology was the EMPATH ESA data collector.
A FEW BASIC POINTS ON ESA/MCSA
Current Fast Fourier Transform (FFT) spectra of amplitude versus frequency is a direct result of variations in the magnetic field as the rotor moves within the air gap of the motor both torsionally and radially. As shaft material is “elastic” and bearings have clearances, vibration from the motor affecting the shaft causes the rotor to move side to side within the air gap. Since most issues in a rotating machine are repetitive, including unbalance, there are distinct frequencies that exist on top of the current sine wave. This results in an evaluation based upon an Amplitude Modulated (AM) signa. which has, by definition, sidebands as opposed to vibration signatures which have single peaks for specific signatures.
The signals are processed in much the same way as vibration analysis spectrum, as well as in a variety of power quality and waveforms, including shaft torque. The result is an FFT signature pattern that can be analyzed for anomalies that have a mathmatical relationship, in most instances, and recognized patterns in which the reasons are still being explored. In the application of pattern recognition, it is not unusual to find a multiple of a running-speed signature then start looking throughout supplied information and drawings to determine what that multiple represents. For instance, a result of “47” might relate to rotor bars in the motor or some other issue within the system.
REGARDING CAVITATION
In vibration, the noise that results from cavitation (a raised noise floor based upon a great many peaks) can often hide other important signatures. ESA has a similar signature, however, cavitation tends to occur in very tight bands around related impeller signatures. Most other signatures of interest remain visible to the analyst, including the running speed. The impeller signature has been found to reside as two peaks around 5 Hz and 15 Hz in virtually all pump applications.
As noted in Fig. 1, there is a raised noise floor about the impeller signature that allows the analyst to determine the running speed of the motor. Once the analyst has the running speed and has access to information on other components, any potential problems can be identified.
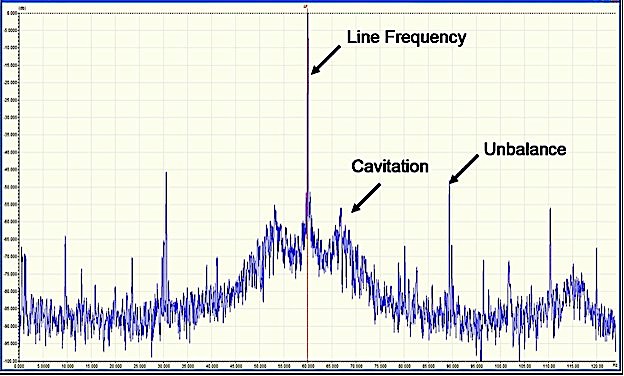
Fig. 1. Cavitation signature in low-frequency-current FFT
The reason for the raised noise floor is that cavitation relates directly to the significant energy that occurs as gases in the pumped fluid come into contact with surfaces such as the impeller and collapse, putting off significant energy. This represents enough energy to remove small amounts of material from these components, as well as damage seal surfaces. Because these “explosions” are random, they result in a very random vibration pattern related to the impeller. As noted in Fig. 1, the raised noise floor is occurring on either side of the line-frequency peak at about 5 Hz.
A GOOD PUMP WITH MINOR ISSUES
When taking data on a motor, having access to a known good machine can provide a valuable comparison. In this case, the two unloaded 30-hp submersibles were compared to contrast a good machine with and bad one. In Fig. 2, the complete low frequency spectra can be analyzed to evaluate conditions related to the motor shaft and impeller.
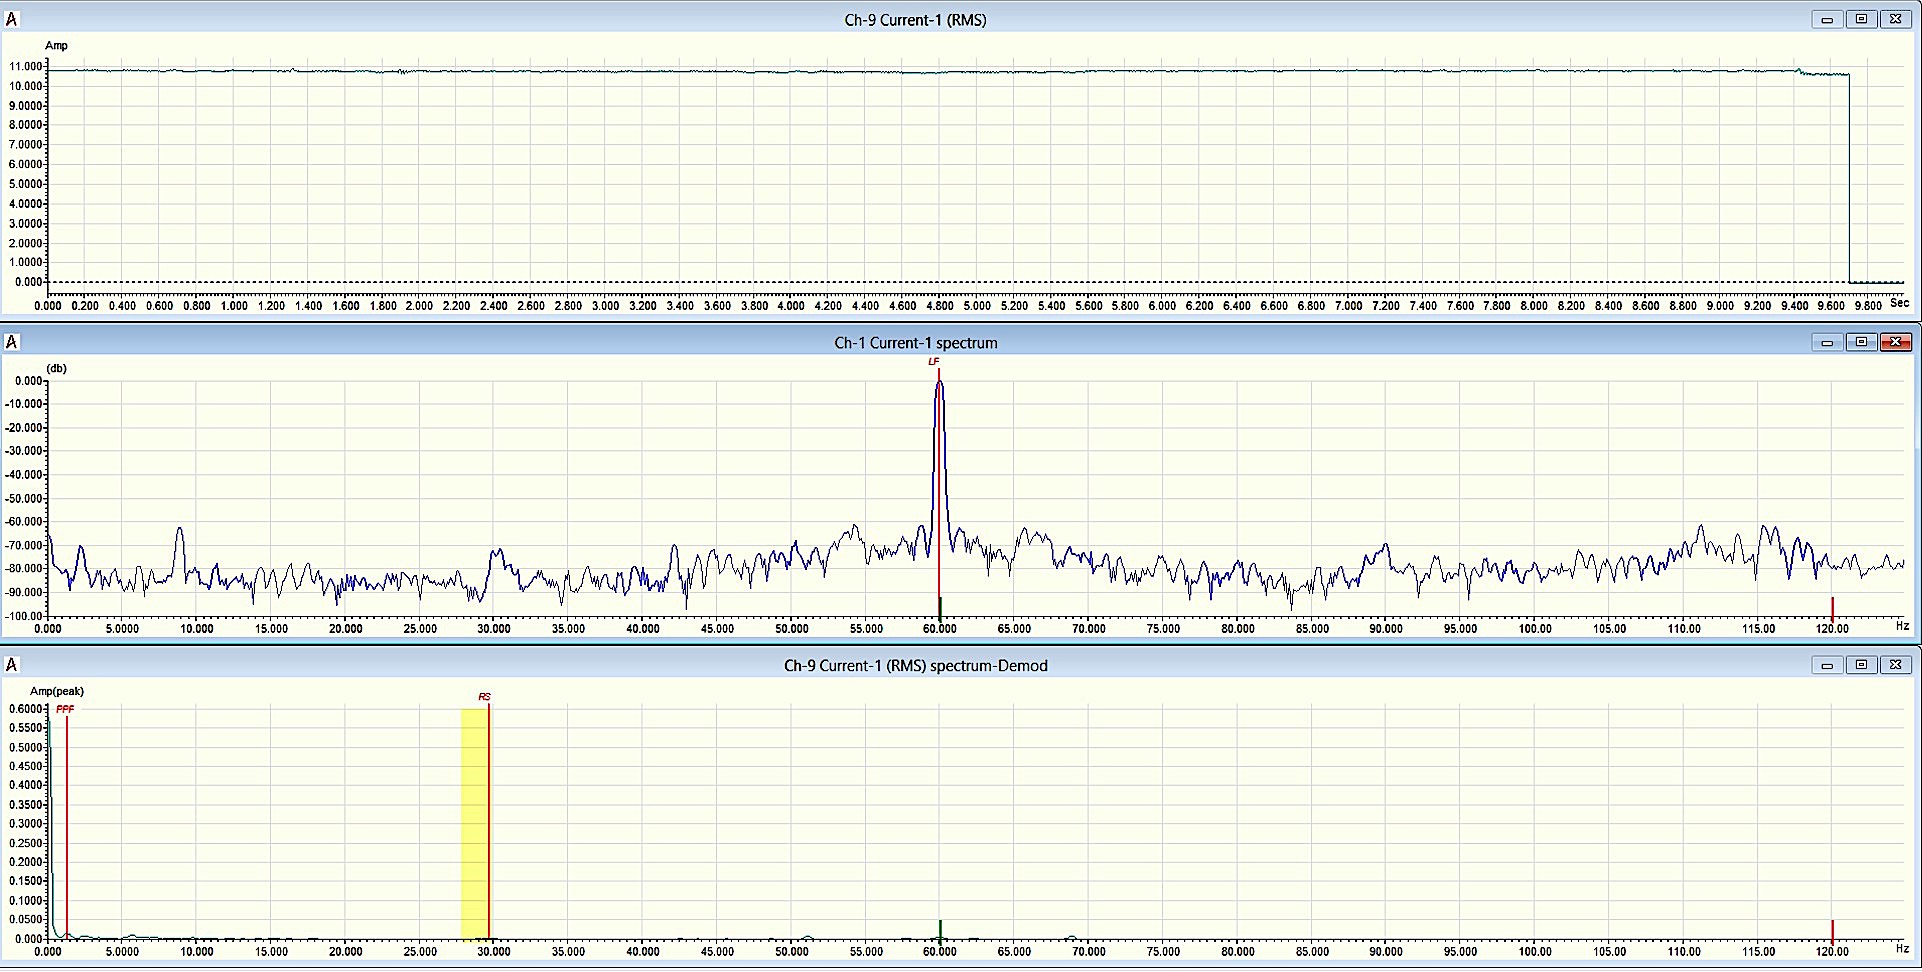
Fig. 2. Good low-frequency ESA results plus Seal issue
As Fig. 2 shows, the top spectra is the RMS current of the pump in question, the middle spectra represents the frequencies immediately surrounding the line frequency, which is the highest peak, and the bottom spectra is the demodulated low frequency spectra. The RMS current represented here indicates that the machine is running smoothly, without too many variations, and is turned off at the end of the analysis. The peak to the far left and noise to the far right in the +/- 45-55 Hz range on either side of the 60 Hz line frequency, which would be +/- 35-45 Hz in a 50 Hz environment, reflects a seal frequency. An existing peak in this range normally means some wear in a mechanical seal. A continuing rise in peaks usually points to failing seal surfaces. The remaining peaks are all under -65 dB from the peak current, indicating no other issues.
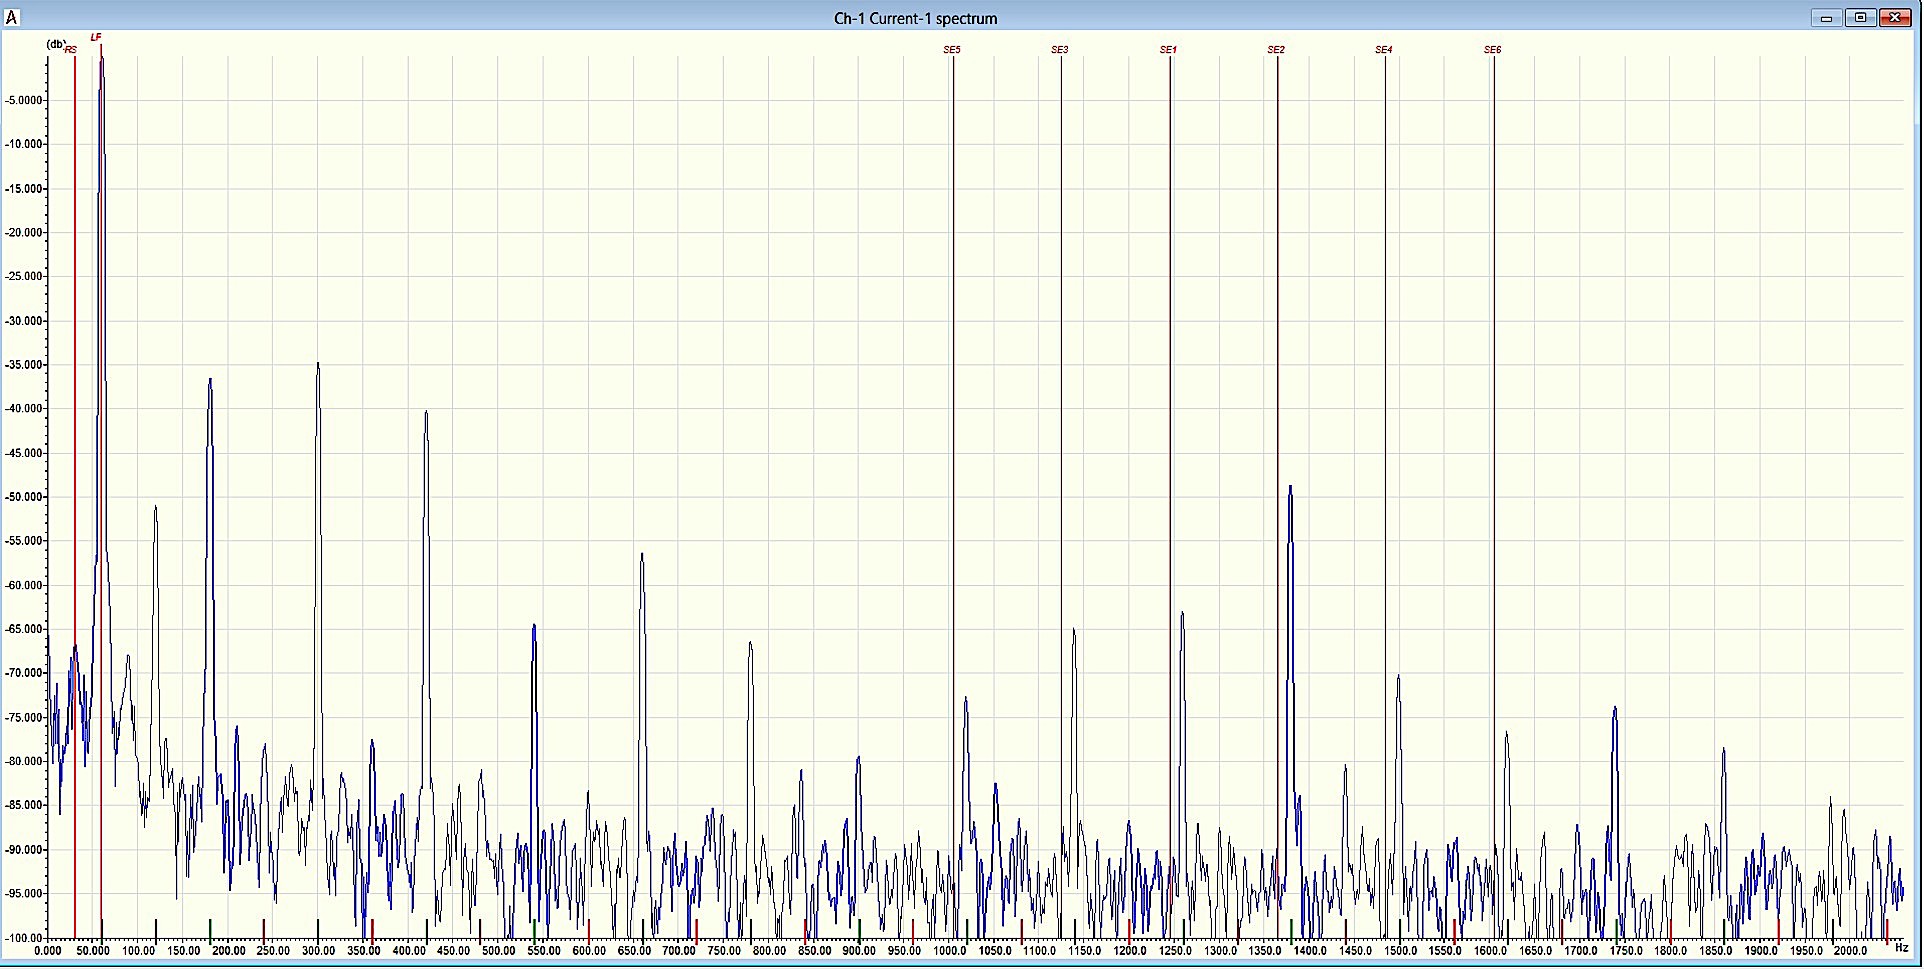
Fig. 3. Testing for static eccentricity in the high-frequency spectrum
The three red vertical lines in Fig. 3 relate to the running speed times, the number of rotor bars, and then line frequency sidebands around that point. This is directly related to static eccentricity. As noted, the lines do not fall across these peaks. instead, these peaks relate to line frequency harmonics as multiples of the applied 60 Hz.
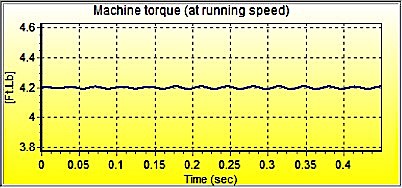
Fig. 4. Torque ripple at running speed
Figure 4 relates to the torque ripple at running speed, of which, in most applications, there will be some level. In this case, the torque line is nearly flat, with little variation, meaning that the motor is running relatively smooth. The small amount that exists comes from a variety of conditions, ranging from fluid flow to power harmonics.
CONTRAST A PUMP WITH MAJOR ISSUES
A second pump is operating suspiciously and requires a comparison. Like the good pump, it is operating lightly loaded. Unusual vibration and noise are detected.
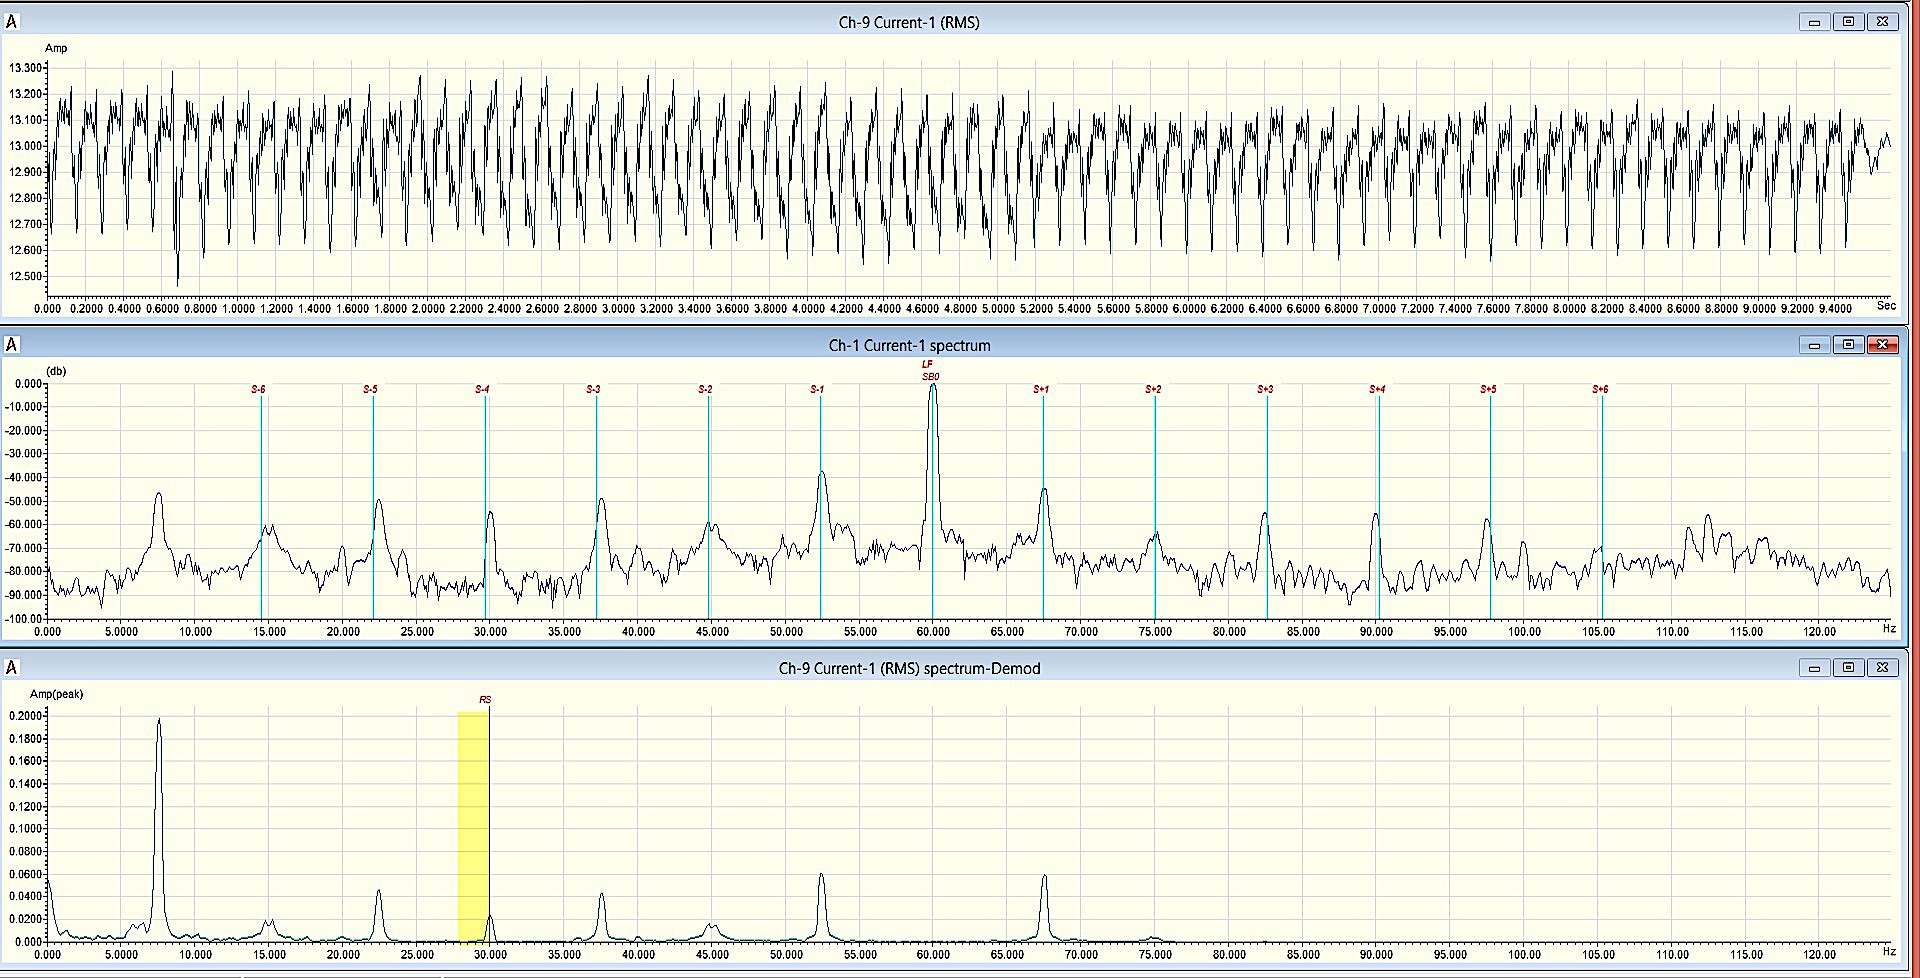
Fig. 5. Bad low-frequency ESA results and seal issue
When comparing Fig. 5 to Fig. 2, it is immediately apparent significant differences exist. As Fig. 5 shows, a series of peaks surrounds the line-frequency peak, and the RMS current is very choppy. By comparing the seal signatures between the two figures, it can be seen that a seal issue may occur soon. And the high peak close to 5 Hz, which has a raised noise floor in the middle spectra, means something is going on around the impeller. The harmonics that are seen are direct sidebands of this frequency, which often indicates some type of impact or rubbing.
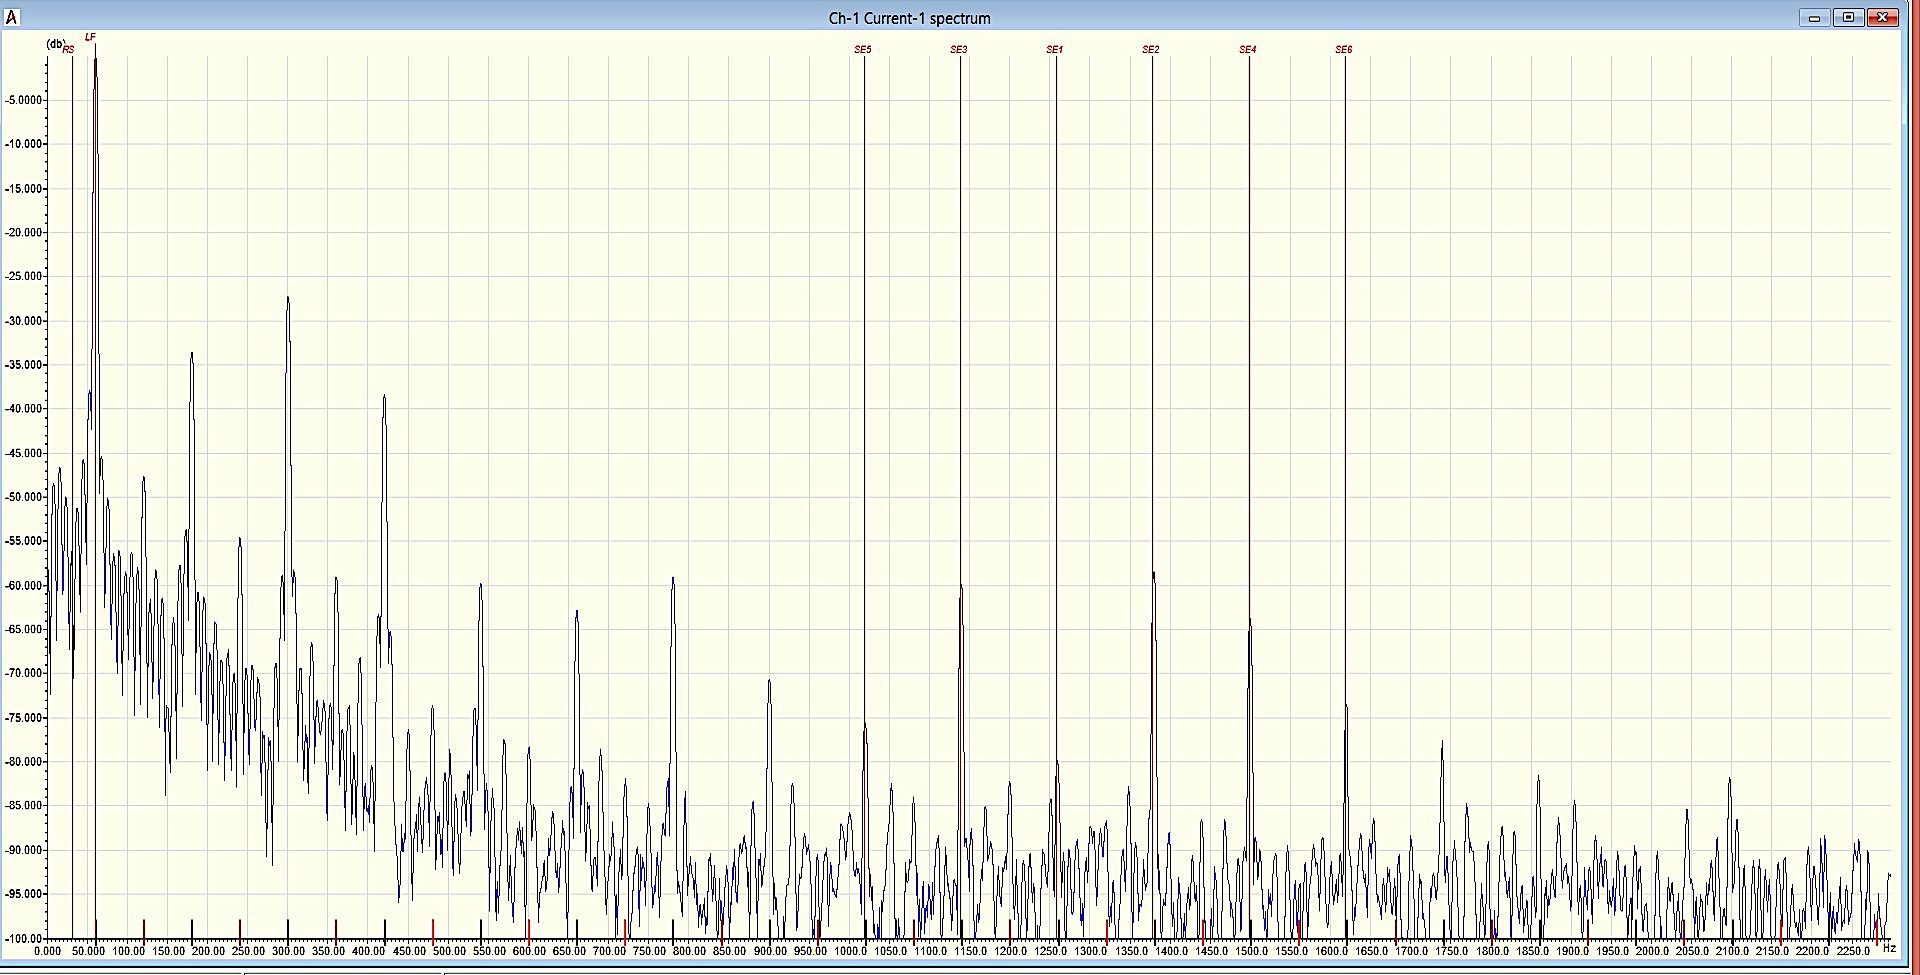
Fig. 6. Static eccentricity
In the case of the second pump compared to the first pump, Fig. 6 shows definite static eccentricity, which means the motor rotor is running to one side of the stator. In fact, the situation is a somewhat more serious, as shown in Fig. 7, which indicates running speed sidebands around these peaks and dynamic eccentricity, or orbiting of the rotor within the air gap.
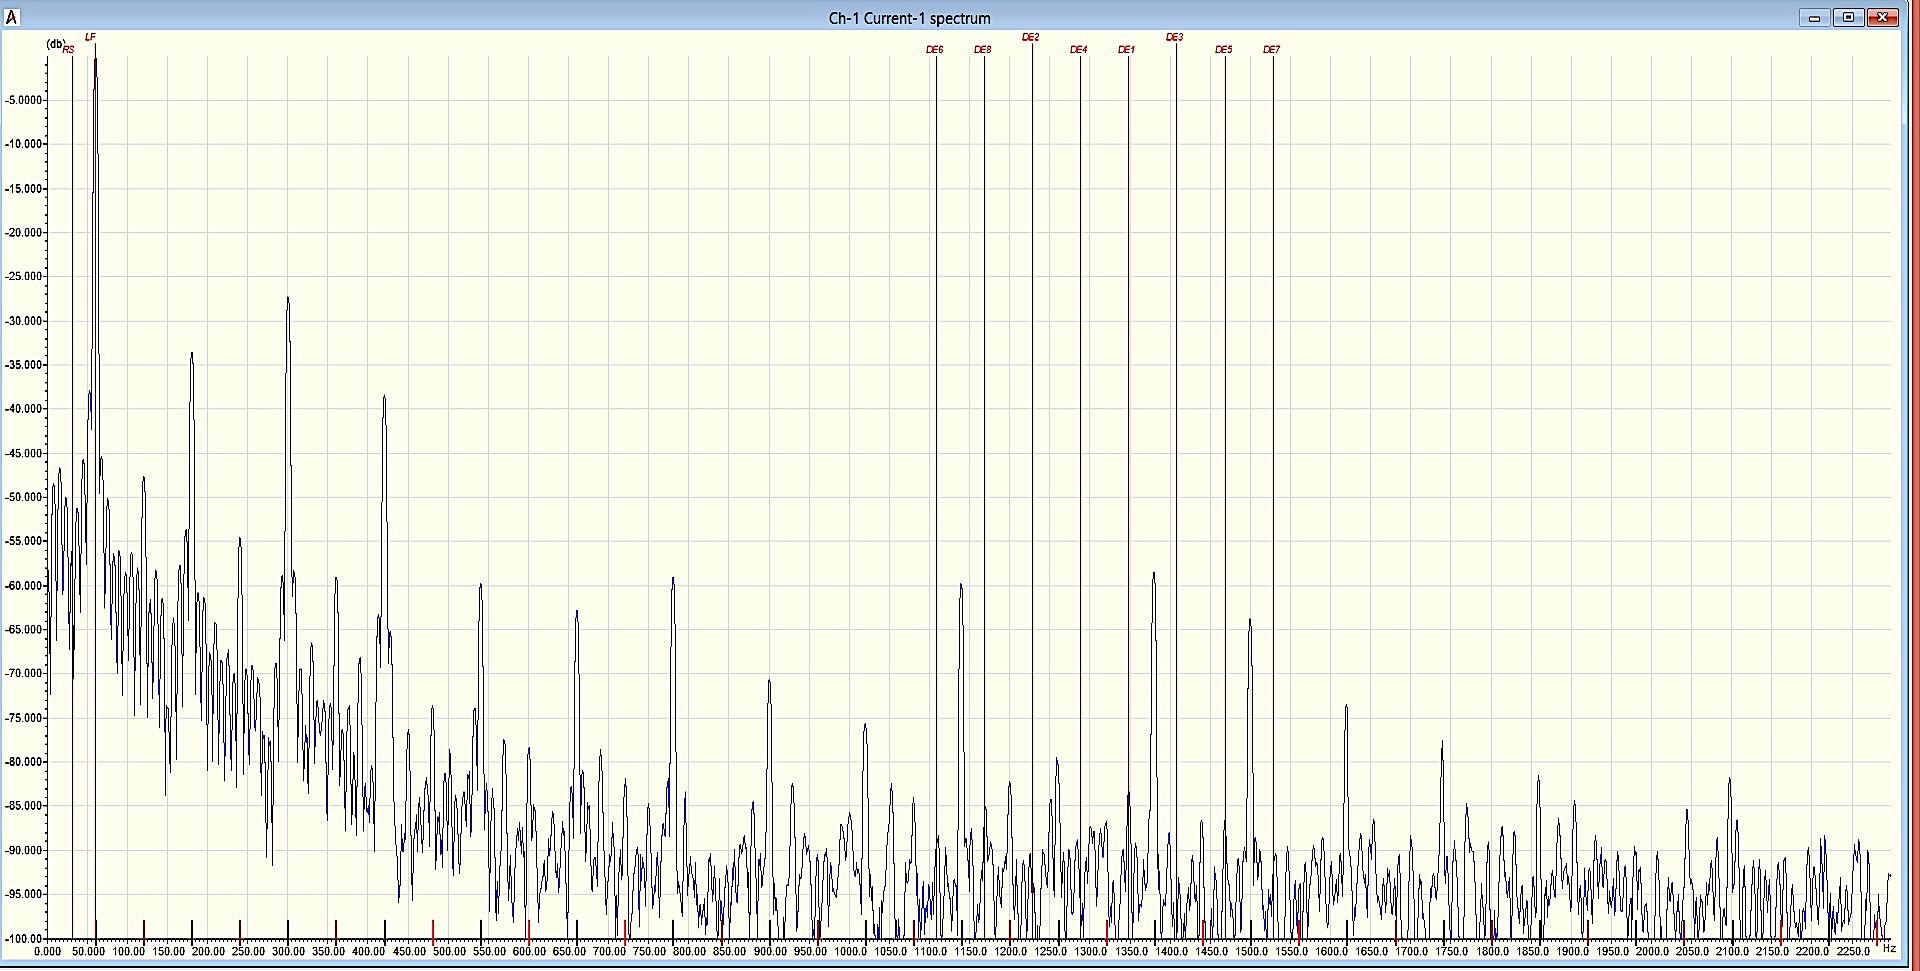
Fig. 7. Dynamic Eccentricity
While rather low, the issue noted in Fig. 7 is still present. It may indicate a bent shaft or some other condition that is causing the rotor to operate off center.
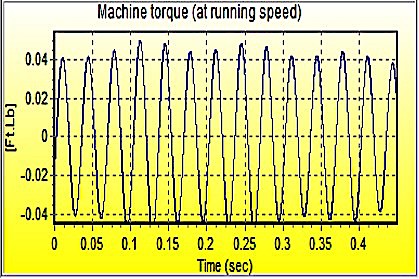
Fig. 8. Bad pump’s torque ripple
Finally, we get to Fig. 8, that shows the torque ripple at running speed, which is surprisingly low. This can help the analyst come to the conclusion that something is happening at the impeller that is causing some level of rub. The situation is either the result of a bent shaft, indicated by the dynamic eccentricity, or the result of the rubbing impeller causing the dynamic and static eccentricity, such as if it were loose or crooked on the shaft. In either case, there is justification for removing the pump from service.TRR
Click On The Following Links for Previous Articles In This Electric-Motor Reliability Series
March 28, 2020: “What The Studies Really Said”
April 12, 2020: “Comparing What The Studies Said”
April 18, 2020: “How The Studies Applied to Larger Motors”
May 2, 2020: “A Data Mind-Bender”
May 29, 2020: “Site and Study Findings Compared”
June 13, 2020: “Developing Testing Programs”
June 19, 2020, “High-Voltage Testing”
July 3, 2020: “Testing with Ohm Meters”
July 10, 2020: “Best Practice to Insulation to Ground Testing Methods”
July 25, 2020: “Annex D in IEEE 43-2013
August 7, 2020: “Advanced Insulation Systems & Hi-Pot Testing”
August 22, 2020: “What Makes Electrical Signature Analysis Different?”
August 28, 2020: “ESA, MCSA, Rotor Bars, Shaft Fault and Bearing Wear“
Sept. 4, 2020: “Trending Rotor Bar Failures (Case Study)”
ABOUT THE AUTHOR
Howard Penrose, Ph.D., CMRP, is Founder and President of Motor Doc LLC, Lombard, IL and, among other things, a Past Chair of the Society for Reliability and Maintenance Professionals, Atlanta (smrp.org). Email him at howard@motordoc.com, or info@motordoc.com, and/or visit motordoc.com.
Tags: motors, drives, motor testing, failure analysis, failure trending, reliability, availability, maintenance, RAM, pumps, submersible pumps, electrical signature analysis, motor current signature analysis

