
Happy New Year! I hope all readers had a pleasant and restful Festive Season. I’m kicking off 2022 with a continuation of my discussion on lagging metrics and key performance indicators (KPIs) for asset management. Here, we’re turning our attention to Quality, the third element of Overall Equipment Effectiveness (OEE). This article is the 12th (and final) installment of a multi-part series on OEE. Previous series installments introduced OEE and addressed Availability, OEE’s first element (in six articles), then tackled Yield/Speed, OEE’s second element (in four articles). You’ll see links to all of them at the end of this article.
Availability quantifies the amount of time our equipment or production process is running as a percentage of total available time (usually 8,760 hours per year). Yield/Speed reflects the rate of production as a percentage of the highest sustained rate for the equipment or process. Quality, as the term suggests, represents the percentage of the production throughput that is on-specification and immediately salable as “first-quality” production with no rework or other corrections. If the equipment or process runs 8,760 hours per year, at 100% of the sustainable rate of production, and turns out 100% first-quality product, production is perfect. Any deviation represents an OEE loss. As previously discussed, these losses may be caused by internal forces associated with the equipment and or production processes or caused by external forces, such as a down-market or supply-chain disruption. The root cause(s) for a loss may by equipment-induced, production-induced, or market/marketing-induced. Form 1 (below) is the formula for calculating the Quality metric for OEE.
 Form. 1. The simple formula for calculating Quality as an input for OEE.
First-quality means the production meets quality specifications with no rework.
THE HIGH COST OF POOR QUALITY
Poor performance on Quality can be quite costly. In some cases, it affects revenue. In others, it affects cost of goods sold (COGS). And in still other cases, it can affect both. In extreme situations, producing poor Quality product carries disposal penalties. Let’s explore these scenarios further.
Poor Quality Compromises Revenue. Ultimately, the quality of our production determines if the business can sell its produced goods and, if so, the price they can fetch. In some instances, off-quality production simply can’t be sold to customers and must be scrapped. If the scrapped product can be sold as scrap, the revenue generated by selling it is typically far less than the revenue generated from selling finished goods. At best, the revenue will match the price paid by the business to purchase the raw material. In other instances, the production can be sold, but not at first-quality prices. Usually, the extent to which off-quality production affects OEE performance depends upon the Quality deviation and varies significantly from industry-to-industry.
Poor Quality Drives Up COGS. When production Quality is compromised, it’s sometimes necessary to perform rework. Take automotive production as an example.
In the paint shop of an automotive assembly facility, fenders, bonnets, and other automotive body parts are painted prior to being installed on the assembly line. If the paint shop conducts a changeover from painting red vehicles to painting white vehicles and the changeover isn’t executed effectively, one could find remnants of red paint on body parts that must be white. In that type of situation, the parts must be reworked. This scenario drives up production costs in a couple of ways: First, the body parts must be stripped down, re-prepped, and repainted, which is costly in terms of labor, materials, and energy. Additionally, inventory turnover is reduced, which results in high carrying costs.
Poor Quality Can Result in Disposal Penalties. In some instances, off-quality production carries disposal penalties. One normally thinks that the worst-case scenario for poor quality is that the manufacturer loses all of its investment into raw materials, energy, labor, overheads, etc., in the event that all or part of the production run must be scrapped. However, in highly regulated industries, the business may incur additional costs to dispose of the scrapped product. For example, the pharmaceutical industry produces products that are often highly regulated. Scrap production of these regulated materials can’t simply be sent to landfills. They often must be destroyed or converted to benign substances under highly controlled conditions This can be very costly.
As is the case for Availability and Yield, Quality losses may be Equipment-, Production-, or Market/Marketing-induced.
EQUIPMENT-INDUCED OEE LOSSES
Equipment that is not designed properly and/or well maintained will struggle to consistently produce at a high level of Quality. To be clear, if the design of the equipment and/or the production process is inadequate, production Quality will suffer. The equipment must also be maintained in tip-top shape to ensure continued Quality of production. If we lack the right parts, materials, skills, and tools to achieve this goal, production quality will suffer.
Preventive maintenance, such as adjustments, lubrication, inspections, etc., must be executed faithfully and correctly. And, of course, corrective maintenance must be executed with a high degree of precision to maintain the assets in a condition that assures high-quality production. Except for Ineffective or Inefficient Work Planning, every equipment-induced loss category in Fig. 1, comes into play to ensure production Quality.
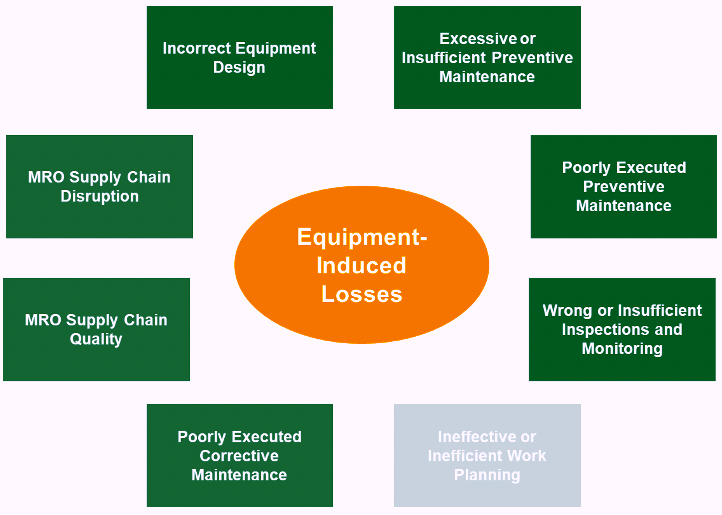
Fig. 1. Equipment-induced factors that influence Quality performance.
PRODUCTION-INDUCED OEE LOSSES
Of the three major loss areas, i.e., equipment-, production-, and market/marketing-induced, those in the production-induced category have the greatest impact on Quality (see Fig. 2).
Operational Overload. In Part 4 of my series on Availability, I discussed how overloading the equipment (or running it beyond its designed capacity or capability) can compromise uptime (Availability). The same forcing function can also adversely affect quality performance (substantially, in many cases). It’s essential that our production teams operate equipment within its acceptable range to ensure Quality and OEE performance.
Denied Access for Maintenance and Care. As previously discussed, machines must be kept in tip-top condition to reliably and consistently produce at a high Quality level. If the maintenance team is denied access to lubricate, make adjustments, change out worn parts, etc., Quality performance will suffer.
Incorrect Adjustment, Recipe or Set-up. Equipment must be properly set up and dialed in to produce at a consistently high level of Quality. Clearly, the initial set-up must be on-recipe. Any deviation will affect quality. However, during production, adjustments in response to production variation must be well-thought through and correct to avoid the all-to-common scenario where the adjustment makes things worse.
Poor Changeover Efficiency or Effectiveness. Changeover efficiency has its greatest impact on Yield. However, changeover effectiveness can greatly influence quality. For manufacturing or process plants that produce a wide range of different products, the changeover from one product to the next is critical to OEE performance. If the changeover is carried out ineffectively, the so-called “A to A” time can be excessive and result in a lot of production that fails to meet quality standards and must be scrapped or reworked. A to A time refers to the time required to transition from making the last product at a first-quality level to making the next product at a first-quality level.
Inefficient Production Scheduling – Excessive Changeovers. Competing forces determine run duration between changeovers. On the one-hand, we want to minimize the previously discussed “A to A” time quality losses. On the other hand, we want to maintain lean inventories of finished goods because of the many inventory-carrying costs, including: a) cost of money; b) space; c) inventory management systems and equipment; d) insurance and taxes; e) spoilage losses; f) pilferage losses; and g) obsolescence losses. Suffice to say, if you want to be lean on inventory and you produce a wide range of products (including different packaging solutions), you must be great at changeovers and very efficient at changeover scheduling.
Supply Chain Disruption – Material Quality. Simply stated, we can’t manufacture high-quality finished products with substandard raw-material inputs, including energy quality. It’s truly a garbage-in, garbage-out scenario. Consider the following example.
I worked with a beverage bottler many years ago. It bottled beverages in glass containers at an amazing rate of production. Then, suddenly, breakage increased dramatically. This was clearly due to some type of quality defect. The only way to prevent the high levels of breakage was to slow the bottling machine down and reduce Yield/Speed.
An investigation into possible machine defects revealed that the equipment was in perfect condition. Digging deeper, however, investigators discovered that procurement changed bottle suppliers shortly before the breakage problems surfaced. (Change Analysis was employed to discover this). Further investigation revealed that the new (and cheaper) supplier delivered bottles with a higher occurrence and degree of dimensional variability. It was garbage-in, which resulted in garbage out for the plant.
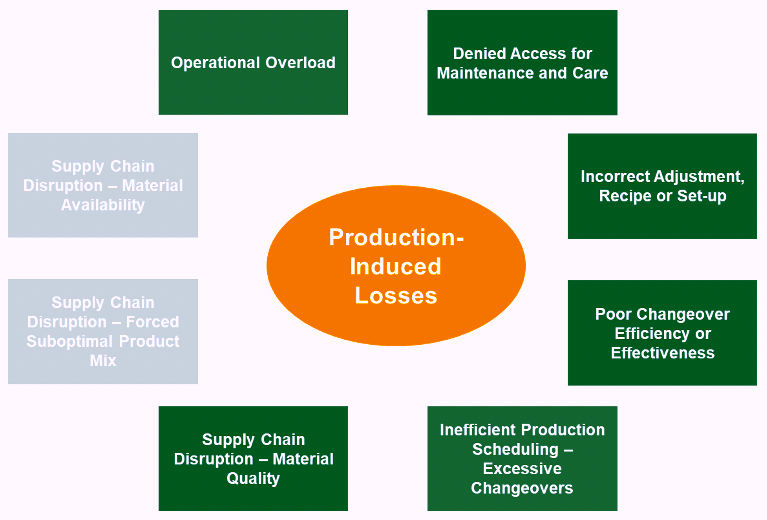
Fig. 2. Production-induced influences have the greatest impact on
the Quality performance in the plant.
MARKET/MARKETING INDUCED OEE LOSSES
Market/marketing-induced factors don’t impact Quality as much as they can impact Availability and/or Yield/Speed. But, if the production capability of the plant and its equipment is oversold, the defect rate can certainly increase (see Fig. 3). An often-overlooked example of this involves labelling. If a marketing department has special labelling requirements to meet specific customer needs or wants to include special promotional labelling on finished goods, havoc can erupt on a production line, particularly in regard to packaging solutions.
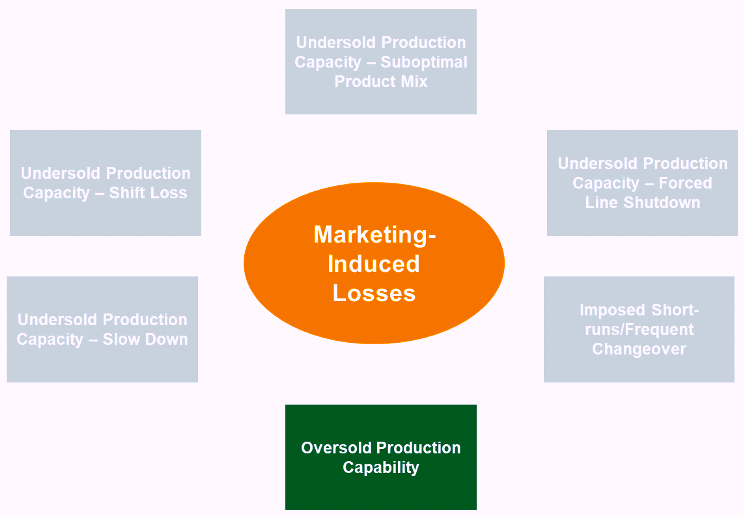
Fig. 3. Marketing can oversell a plant’s capability and
compromise Quality performance.
SERIES CONCLUSIONS
Overall Equipment Effectiveness (OEE) reflects the performance of a machine, process line, or plant as compared to perfection. Availability reflects operating time as a percentage of the maximum available (e.g., 8,760 hours per year), Yield/Speed reflects the rate of production as compared to the highest sustainable rate. Quality reflects the percentage of production that is first-quality on the first pass (no scrap or rework). It doesn’t matter how many hours we operate or how fast we operate during those hours if the production is substandard and/or unsalable.
In this final installment on our series on OEE, we discussed internal and external forcing functions that can compromise Quality performance and OEE. Some of these are equipment-induced and relate to the health of the machines. Others are production-induced, and relate to input material quality, production processes, and production changeover effectiveness. Market/marketing-induced factors relate to the absolute requirement that our colleagues in marketing are selling and promoting within the capability range of our equipment and production processes. All are important.
Now, it’s time for you to put OEE to work for you. Monitor and trend OEE, categorize losses as internal or external equipment-, production-, and/or market/marketing-induced in nature. Then take actions to eliminate the losses.TRR
Click The Following Links For 11 Previous Installments Of The Referenced OEE Series
“Lagging Indicators For Asset Management: OEE
(Overall Equipment Effectiveness)”
“OEE’s First Element (AVAILABILITY, Part 1)”
“OEE’s First Element (AVAILABILITY, Part 2)”
“OEE’s First Element (AVAILABILITY, Part 3)”
“OEE’s First Element (AVAILABILITY, Part 4)”
“OEE’s First Element (AVAILABILITY, Part 5)”
“OEE’s First Element (AVAILABILITY, Part 6)”
“OEE’s Second Element (YIELD/SPEED, Part 1)”
“OEE’s Second Element (YIELD/SPEED, Part 2)”
“OEE’s Second Element (YIELD/SPEED, Part 3)”
“OEE’s Second Element (YIELD/SPEED, Part 4)”
REFERENCES
Troyer, Drew (2008-2021). Plant Reliability in Dollars & $ense Training Course Book.
ABOUT THE AUTHOR
Drew Troyer has over 30 years of experience in the RAM arena. Currently a Principal with T.A. Cook Consultants, he was a Co-founder and former CEO of Noria Corporation. A trusted advisor to a global blue chip client base, this industry veteran has authored or co-authored more than 300 books, chapters, course books, articles, and technical papers and is popular keynote and technical speaker at conferences around the world. A Certified Reliability Engineer (CRE) and a Certified Maintenance & Reliability Professional (CMRP), he holds B.S. and M.B.A. degrees. Drew, who also earned a Master’s degree in Environmental Sustainability from Harvard University, is very passionate about sustainable manufacturing. Contact him at 512-800-6031, or email dtroyer@theramreview.com.
Tags: reliability, availability, maintenance, RAM, Overall Equipment Effectiveness, OEE, metrics, key performance indicators, KPIs, Quality, first-quality production

