
In Parts 1 and 2 of this series on the second element of Overall Equipment Effectiveness (OEE), we discussed Yield/Speed in general, as well as various equipment-related issues of poor yield performance (see links to Parts 1 and 2 below.) This week, we are looking at production-induced Yield/Speed losses. As asset managers, we’re normally concerned about production or operations teams running plant equipment too hard, which leads to stress vs. strength interference and can compromise the reliability of the machinery.
Click The Following Links To The Previous Articles In This Series
As previously discussed in this series, I’ve proposed a workaround to the traditional formula for Yield/Speed, whereby the Actual Rate is simply divided by the Highest Sustained Rate per hour, minute, or other time increment. My modification requires subtracting the absolute value of any deviation from the Highest Sustained Rate, dividing that value by the Highest Sustained Rate, and multiplying by 100 to arrive at a percentage value (Form. 1).
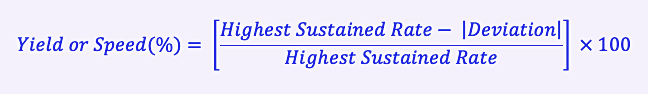
Form. 1. The Troyer workaround formula to eliminate the possibility
that the Yield/Speed metric can exceed 100%.
For example, if the Highest Sustained Rate is 1,000 units per hour and we produce 800 units per hour, the Yield/Speed is 80%. If the same unit, however, is operated at 1,200 units per hour, rather than a Yield/Speed of 120%, it would be 80% if my suggested adjustment to the equation is followed. It should be because Yield/Speed is one the inputs into OEE, which has a maximum theoretical value of 100%. A value higher than 100% compromises the viability of the entire OEE metric as a Key Performance Indicator (KPI). While running the equipment too hard and beyond its Highest Sustained Rate of production is common, there are numerous production-induced causes for Yield/Speed losses. Let’s examine them here.
PRODUCTION-INDUCED OEE LOSSES
The primary causes for production-induced forced derating of a machine include: a) incorrect recipe or set-up; b) poor changeover efficiency or effectiveness; c) inefficient production scheduling/excessive changeovers; d) supply chain disruption – material quality; and e) supply-chain disruption – material availability (Fig. 1).
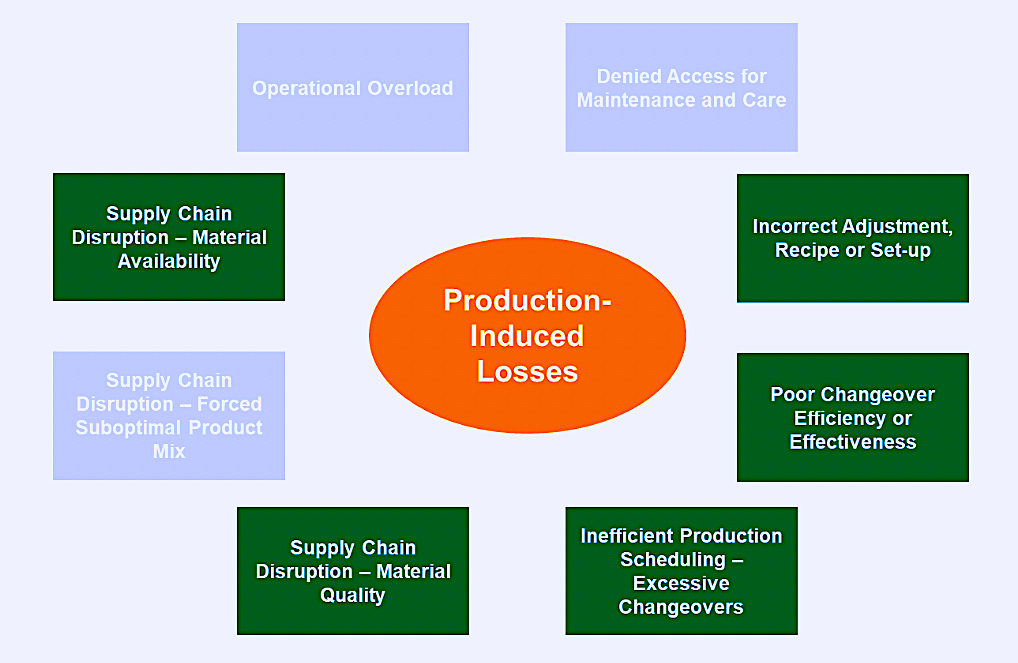
Fig. 1. Common production-induced causes for reduced Yield/Speed performance.
Incorrect Recipe or Set-Up and Poor Changeover Efficiency or Effectiveness.Many machines in the manufacturing or process industries are responsible for making multiple products that vary in terms of type, size, or other technical specifications. For plants that make consumer products, those specifications also may involve some rather intricate packaging solutions. Every time the recipe is changed, there is a risk of mistakes that force the operators to run the machine at a lower Yield/Speed rate to avoid stoppages, quality defects, safety risks, and/or environmental risks until such time that such issues can be corrected. The root causes for these situations usually come down to:
-
- lack of or ineffective procedures
- lack of training
- lapses or other personnel errors
- inadequate supervision or oversight.
It’s easy to simply blame the operator for those mistakes. However, in my 30+ years as a reliability engineer, I’ve found that it’s usually the organizational artifacts that are the root causes. One need only look to the practices of the commercial aviation, nuclear power, and other High-Reliability Organizations (HROs) to find that they are highly procedure-driven, train effectively to those procedures, and maintain oversight to assure that the procedures are executed correctly. We in the manufacturing and process industries must follow the lead of HROs to remedy these deficiencies.
Inefficient Production Scheduling – Excessive Changeovers. Even the best executed changeovers utilizing great recipes and/or set-up instructions introduce some degree of variability in the process that can force Yield/Speed derates until the operation is stabilized. Unfortunately, with assets that run multiple processes or manufacture multiple products, we must balance changeover frequency with the cost of holding inventory. Lean operations generally prefer to minimize the amount of inventory that’s held. A general rule of thumb is that the carrying cost for inventory is 22% of the average inventory value per year. So, holding $1,000,000 in inventory costs the firm $220,000 per year. This varies greatly by industry and what’s being held in inventory, but the cost includes:
-
- the time value of money that could otherwise be productively invested
- the cost of space racks and other hardware and IT systems to hold the inventory
- the cost of people to manage the inventory
- insurance and taxes
- shrinkage and pilferage losses
- shelf-degradation losses
- obsolescence losses.
I’m a big believer in maintaining a lean, just-in-time or near just-in-time inventory management policy. But the cost of holding inventory must be carefully balanced relative to the many possible losses associated with excessive changeover frequency, which, in addition to impacting Yield/Speed performance, can also adversely affect Availability and Quality.
Supply Chain Disruptions – Material Availability and/or Quality. Production operations depend upon inputs of raw materials and energy. If these aren’t available in sufficient supply, it may be necessary to derate the production Yield/Speed rate. Likewise, poor quality of production inputs can force a slowdown.
As an example, I once worked with a bottler of consumer beverages for which glass was the dominant container. Those operations were never able to run at the rated Yield/Speed rate for certain products. If they did, they suffered spills, breakages, and quality defects. An investigation revealed that the procurement team found a cheaper source for bottles. As it turned out, though, that low-cost supplier had a much higher rate of dimensional variation from bottle-to-bottle than the previous supplier. The cost savings paled in comparison to the Yield/Speed losses. The procurement specialist was well-intentioned, but the error was an expensive one.
Note: Yield/Speed derates caused by disruptions in supply-chain availability can be mitigated with inventory or buffers. This approach, however, is a costly option.
It’s also important to note that a supply chain can be internal as well as external. For instance, in the mining industry, drills and shovels feed ore to haul trucks, which dump into the primary crusher before being conveyed to the secondary crusher, and so on. Upstream disruptions in available feed material can force downstream derating of the Yield/Speed. Additionally, upstream feedstock quality problems can force a derate of Yield/Speed. For instance, in our mining example, if ore is not adequately crushed at the primary crusher and the rocks are too big, if can force a reduction in the production rate downstream of the crusher to avoid serious problems.
CONCLUSIONS
When we consider production-induced problems with the Yield/Speed metric in the formula for Overall Equipment Effectiveness (OEE), we normally think about the production team running the equipment too hard. We address the mathematical problem that’s produced in the OEE metric using my proposed modification to the traditional Yield/Speed formula by subtracting the absolute value of any Yield/Speed rate deviation from the Highest Sustained Rate and dividing that value by the Highest Sustained Rate. This prevents the Yield/Speed input value from exceeding 100%.
We must also recognize that incorrect recipes or changeover set-up, ineffective changeover, changing over too frequently, and supply-chain availability and/or quality problems can also force a derate of the machine or plant’s Yield/Speed performance and, in turn, adversely affect OEE.
In next week’s edition of The RAM Review, we’ll address market/marketing-induces causes for Yield/Speed derating.TRR
REFERENCES
Troyer, Drew (2008-2021). Plant Reliability in Dollars & $ense Training Course Book
ABOUT THE AUTHOR
Drew Troyer has over 30 years of experience in the RAM arena. Currently a Principal with T.A. Cook Consultants, he was a Co-founder and former CEO of Noria Corporation. A trusted advisor to a global blue chip client base, this industry veteran has authored or co-authored more than 300 books, chapters, course books, articles, and technical papers and is popular keynote and technical speaker at conferences around the world. A Certified Reliability Engineer (CRE) and a Certified Maintenance & Reliability Professional (CMRP), he holds B.S. and M.B.A. degrees. Drew, who also earned a Master’s degree in Environmental Sustainability from Harvard University, is very passionate about sustainable manufacturing. Contact him at 512-800-6031, or email dtroyer@theramreview.com.
Tags: reliability, availability, maintenance, RAM, metrics, key performance indicators, KPIs, Yield/Speed, OEE

