
Having explored Availability, the first element of Overall Equipment Effectiveness (OEE), in detail, we will now be examining OEE’s second element: Yield/Speed. As we begin this new discussion, keep these points in mind: Availability quantifies the amount of time an asset or assets operate as a function of the total available time. The total number of operating hours is divided by 8,760 to determine Availability. The unit of time can also be converted to minutes or seconds to achieve greater granularity. But, irrespective of the specific unit, the denominator is fixed. So the maximum achievable Availability is 100%.
The Yield/Speed metric employs a similar mathematical approach, but the numerator equals the actual production volume per hour, minute, second, or any other measure of time, and the denominator is defined as an asset’s best, i.e., its “Highest Sustainable.” rate of production. This rate is typically presented as a percentage. Form. 1 illustrates the simple formula for calculating Yield/Speed.
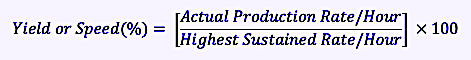 Form. 1. The formula required to calculate Yield or Speed
expressed as a percentage.
For Availability and OEE’s third element, Quality, the maximum performance mathematically is 100%, assuming the sanctity of the denominator is retained. The numerator is intended to be the variable component in the OEE-element formula. When both the numerator and the denominator are made variable, the usefulness of relative metric is compromised. That’s why we must always employ 8,760 hours in the denominator of the Availability metric.
With the Yield/Speed metric, the Highest Sustained Rate/Hour is somewhat tricky in that it may not reflect the highest rate that the machine can operate. Rather, it is the highest rate of speed at which the machine is believed to run reliably. Running beyond this Highest Sustained Rate/Hour introduces Stress vs. Strength interference (Fig.1). When the equipment is operated beyond its sustainable capability, reliability and availability usually suffer.
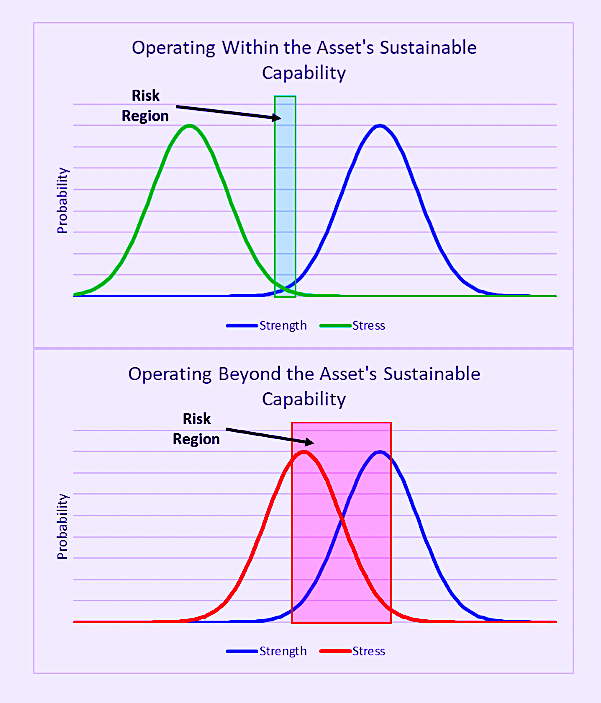
Fig. 1. When the sustainable rate of production is observed, risk is low,
and the asset is typically reliable. If that rate is routinely exceeded,
risk is introduced, which puts reliability at risk.
In some plants, this denominator in the Yield/Speed calculation is a hotly contested, highly charged topic. Production managers often want to push this number up. Reliability engineers and asset managers often are reluctant to do so. It can be quite a point of contention because, unlike knowing the number of hours in a year, determining the Highest Sustained Rate/Hour is a less exacting science. Let’s explore further.
END TIMES: ‘WE NEED TO MAKE UP GROUND’
It’s a common scenario in plants: Production teams are under the gun to hit a number. Bonus pay and other incentives are often on the line.
Suppose it’s the end of the month or quarter, and that production to date is lagging projections. The production team is incentivized to crank up the speed to make up that lost ground. Suppose we have a line that’s designed for a highest sustained rate of 1,000 units/hour, but we routinely push the asset to 1,200 units per hour.
Form. 2 illustrates how that approach impacts the Yield/Speed performance. On the surface, it looks great, but pushing Yield/Speed above 100% usually compromises either Availability performance and/or Quality of production. Also, each element of the OEE should have a maximum value of 100% so that the product of the three elements has a maximum value of 100%. Additionally, when the yield value exceeds 100%, the validity of the OEE metric is compromised.
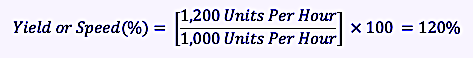 Form. 2. Example of when Highest Sustainable Rate of production
is exceeded. Yield/Speed should never exceed 100%.
REVISED YIELD/SPEED FORMULA (A DREW TROYER WORKAROUND)
Having recognized the challenge associated with the Yield/Speed element of OEE, I devised the following workaround several years ago. While it’s not perfect, I’ve found it to be effective.
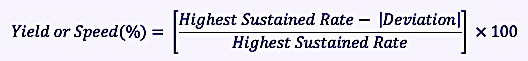
I calculate the Yield/Speed metric by subtracting the absolute value of the deviation from the Highest Sustained Rate of production, divide that value by the Highest Sustained Rate, then multiply by 100 to express the Yield/Speed as a percentage (Form. 3). This prevents the metric from exceeding 100%.
 Form. 3. Formula for my workaround to eliminate the possibility
that the Yield/Speed metric can exceed 100%.
In our example, where the Highest Sustained Rate of production was 1,000 units per hour and we operate at 1,200 units per hour, the conventional Yield/Speed formula produces a value of 120%, which is problematic. Using my Yield/Speed-formula workaround, the absolute value of the overproduction is subtracted from the Highest Sustained Rate of 1,000 units per hour, which results in a Yield/Speed of 80% (Form. 4).
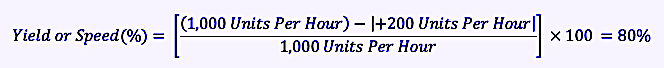 Form. 4. This revised formula for Yield/Speed in the OEE calculation
rewards compliance to the Highest Sustained Rate and penalizes
any deviations, be they positive or negative.
Whenever I propose this revised approach, the immediate response from production and operations managers is usually negative. Those managers typically interpret the mission of the organization from the perspective of maximizing production throughput. That’s understandable given the lens through which they view the mission. The true mission of the organization, though, is to maximize profitability, not production.
If it has been determined that the defined Highest Sustained Rate of production achieves the goal of profit maximization, compliance to the Highest Sustained Rate should be rewarded. Moreover, any deviation (positive or negative) should be penalized. I believe my revised formula for measuring and trending Yield/Speed helps achieve this objective.
CONCLUSIONS
This article is the first installment in a series on Yield/Speed, the second element of the Overall Equipment Effectiveness (OEE) metric. The Yield/Speed element represents the production rate per hour (or other time relationship) compared to an asset’s Highest Sustained Rate.
In my opinion, Yield/Speed is the most challenging of OEE’s three elements to calculate due to the fact that there’s no fixed, absolute maximum for the denominator. Typically, it’s possible to run machines at a rate that exceeds the Highest Sustained Rate. But that produces a value exceeding 100% and breaks the rules for using OEE to measure production success.
Among other things, this article has highlighted the traditional formula for calculating Yield/Speed, as well as an alternative one that penalizes any deviation (positive or negative) from the asset’s Highest Sustained Rate of production. As is the case with Availability, causes for reduced Yield/Speed performance can take many forms. Some are equipment-induced, some production-induced, and some market- or marketing-induced. We’ll explore all of them in future articles.TRR
REFERENCES
Troyer, Drew (2008-2021). Plant Reliability in Dollars & $ense Training Course Book
ABOUT THE AUTHOR
Drew Troyer has over 30 years of experience in the RAM arena. Currently a Principal with T.A. Cook Consultants, he was a Co-founder and former CEO of Noria Corporation. A trusted advisor to a global blue chip client base, this industry veteran has authored or co-authored more than 300 books, chapters, course books, articles, and technical papers and is popular keynote and technical speaker at conferences around the world. A Certified Reliability Engineer (CRE) and a Certified Maintenance & Reliability Professional (CMRP), he holds B.S. and M.B.A. degrees. Drew, who also earned a Master’s degree in Environmental Sustainability from Harvard University, is very passionate about sustainable manufacturing. Contact him at 512-800-6031, or email dtroyer@theramreview.com.
Tags: reliability, availability, maintenance, RAM, metrics, key performance indicators, KPIs, Yield/Speed, OEE

