As we continue our discussion of important asset-management metrics and Key Performance Indicators (KPIs), let us turn our attention to Overall Equipment Effectiveness (OEE) in the first of what will be several articles on this particular indicator. OEE is calculated by multiplying three percentages: availability, speed/performance/yield, and quality to determine a plant’s performance compared to perfection. It’s then expressed as a percentage with a maximum value of 100%. Subtracted from OEE are equipment failures (breakdowns), scheduled downtime for maintenance, set-up and adjustments, idling and minor stoppages, speed reductions, defects and rework requirements, and startup losses (Fig. 1).
While OEE is a useful metric, interpreting it can be tricky. For example, on the surface, it seems that an organization should maximize OEE. In reality, the goal is to optimize OEE to maximize profits and Return on Net Assets (RONA). Here, we begin exploring the potential benefits and the potential pitfalls associated with deploying OEE as an asset- management metric.
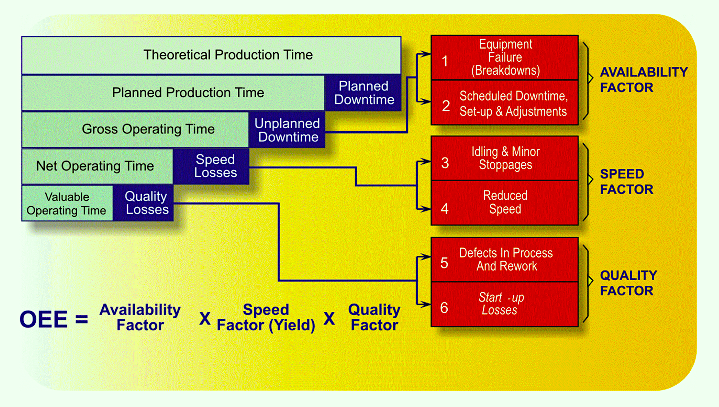
Fig. 1. Summary of OEE and its primary eroding components.
A BRIEF HISTORY OF OEE
Use of Overall Equipment Effectiveness as a metric was first described by Seiichi Nakajima’s Total Productive Maintenance (TPM). Nakajima created the TPM concept in 1969 for Nippon Denso, a subsidiary of the Toyota Motor Corporation, while he was with the Japan Institute of Plant Maintenance (JIPM). TPM and, by association, OEE, became central components of the Toyota Production System (TPS), which was the basis for Lean Manufacturing. OEE plays an important role as the scorecard for eliminating the so-called “deadly wastes.” Some references identify six of them, while others identify seven. I personally prefer to reference “Eight Deadly Wastes.”
Most references agree that overproduction, waiting, unnecessary transport or conveyance, excess inventory, unnecessary movement, and defects create waste. I like to add another waste to the list: unused employee creativity. In fact, to me, it is the mother waste. If we effectively tap into the collective wisdom of our entire production team and create a “Why-Why” culture focused on defect avoidance and elimination and continuous improvement, we find that the effect of those other wastes tends to shrink and OEE tends to increase.
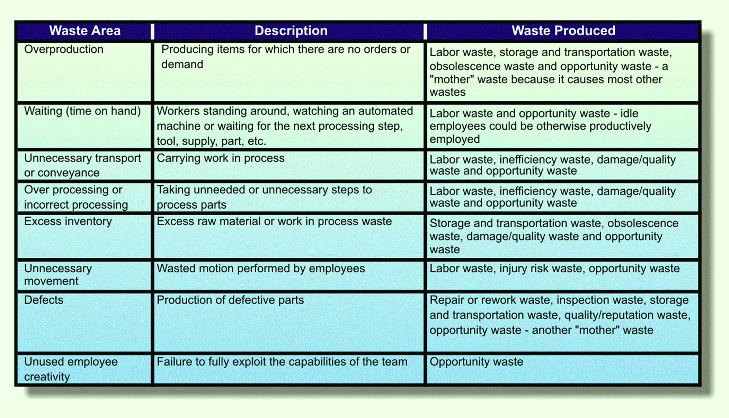 Fig. 2. The “Eight Deadly Wastes” that erode production output.
Many organizations have put their own spin on the OEE metric. Consider, for example, that some process operations don’t include quality in their OEE equations. I have known of power-generation stations replacing quality with Heat Rate, which is an energy-conversion efficiency metric. For process industries, where quality doesn’t fit as neatly as it does in manufacturing operations, some version of energy efficiency not only makes sense, it touches upon our mission component to reduce the plant’s environmental footprint. While it’s appropriate to modify the OEE metric to fit your organization’s situation and needs, it must be applied consistently over time to support effective asset-management decisions.
In its purest form, OEE is calculated based on dividing the plant’s actual operating hours by 8,760 hour per year to determine Availability. Operating hours may be converted from hours to minutes or seconds for increased granularity. The plant’s actual production rate is divided by its best sustained rate to determine Speed/Performance/Yield. Quality is calculated by dividing the first-pass “A-quality” production by the total production. So, we’re comparing actual performance to perfection.
Some organization prefer to use two related metrics: OEE and Total Effective Equipment Performance (TEEP). In this type of scenario, TEEP is employed to compare actual performance to theoretical performance and OEE as a comparison of actual performance to planned performance. That’s where things start getting tricky: Like other percentage-based relative metrics, OEE can become difficult to trend and track over time when both numerator and denominator in the equation are variables. But as previously stated, we are seeking to optimize OEE, TEEP, or similar overarching metrics so that profitability can be maximized.
It’s certainly not my intention to criticize OEE. Still, we must clearly understand the dynamics that influence this metric and plan accordingly. (I’ll address those dynamics in future articles, when I dig deeper into the individual factors of Availability, Yield/Speed and Quality.)
GOOD QUESTION: SHOULD ‘OEE’ REALLY BE
‘OVERALL BUSINESS EFFECTIVENSS (OBE)’?
I’ve struggled over the years about the naming of the OEE metric. This label suggests that the blame for wastes and losses rests with the equipment. In the real world, most organization endure losses that are marketing-related, production-related, and equipment-related. So, should we rename OEE to Overall Business Effectiveness (OBE) and then track Overall Marketing Effectiveness (OME), Overall Production Effectiveness (OPE), and OEE separately?
Let me explain. What if the plant isn’t sold out and actually has spare capacity? That’s not really an equipment problem. It’s a marketing problem. Thus, we would either need to do a better job promoting the plant’s output or developing new products that are in demand. Likewise, what if the sales team commits to delivery of a product or variation that isn’t manufacturable? The equipment might be perfectly capable of producing what it’s designed to produce, but incapable of producing what the sales team has agreed to deliver. That is a marketing problem, not an equipment problem. Likewise, what if the sales team commits to deliver a quantity of a specialized product that’s too small and beyond the flexibility designed into the asset? The list of such “what ifs” can be long. In sum, though, undersold capacity or oversold capability are marketing-induced losses, not equipment issues. We should track marketing-induced losses separately and trend OME.
On the production side, we may have a supply-chain issue whereby we can’t get raw materials, energy, or other required production inputs. The equipment may be perfectly capable of producing, but it’s stalled out without the necessary inputs. In addition to the quantity of production inputs, if the quality of the inputs is substandard, performance will be affected. The equipment may be fine, but garbage in equals garbage out. The operators themselves may fail to perform equipment set-up or changeover to a new product effectively. Or they may simply operate the equipment incorrectly or push it beyond its design limits. Production availability, yield/speed and/or quality may suffer, but the fault wouldn’t really lie with the equipment. We should track production-induced losses separately and trend OPE.
Yes, we see OEE losses that are specifically equipment related. The equipment may not be designed correctly for reliability, maintainability, operability, flexibility, and all the other “abilities” that are required to meet needs of the business. Insufficient, excessive, sub-optimal, or poorly executed inspections, condition monitoring, and preventive maintenance can all adversely affect OEE. Poor planning, scheduling, coordination, and execution of corrective maintenance will also affect OEE, as will the lack of proper parts that are fit for use. We should track equipment-induced losses and separately trend OEE. But there is no equipment-related remedy that can solve problems resulting from marketing- and production-induced losses. We really need to think of this as Overall Business Effectiveness (OBE).
As a case in point, I have worked with many clients over the years to help them refine their processes for tracking losses. Figure 3 illustrates a contrast between two of those clients. When we broke down the losses for Client A, 45.7% of the total losses were attributable to marketing issues, 33.5% to production problems, and 20.8% to equipment issues. Client B’s losses were more evenly distributed among marketing-, production- and equipment-induced losses.
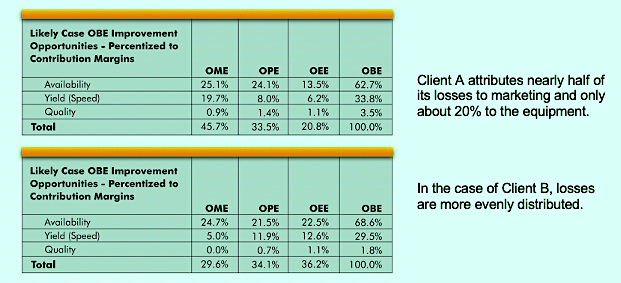
Fig. 3. Comparison of the distribution of losses among
marketing-, production- and equipment-related problems.
CONCLUSION
Overall Equipment Effectiveness (OEE) is an elegant but complicated asset-management metric. Used properly, with a clear focus on optimizing it to maximize profitability or Return on Net Assets (RONA), OEE can help guide good decisions. Keep in mind, however, that the underlying reasons for sub-par OEE performance won’t always be equipment related. In many cases, they will be marketing or production induced. Therefore, users must carefully collect information about production losses and target corrective actions accordingly.
Next week we’ll tackle the Availability component of OEE.TRR
REFERENCES
Troyer, Drew (2008-2021). Plant Reliability in Dollars & $ense Training Course Book.
Troyer, Drew (2007). “Think of OEE as Overall Business Effectiveness,” Reliable Plant Magazine. July/August Issue.
ABOUT THE AUTHOR
Drew Troyer has over 30 years of experience in the RAM arena. Currently a Principal with T.A. Cook Consultants, he was a Co-founder and former CEO of Noria Corporation. A trusted advisor to a global blue chip client base, this industry veteran has authored or co-authored more than 300 books, chapters, course books, articles, and technical papers and is popular keynote and technical speaker at conferences around the world. Drew is a Certified Reliability Engineer (CRE), Certified Maintenance & Reliability Professional (CMRP), holds B.S. and M.B.A. degrees. Drew, who also earned a Master’s degree in Environmental Sustainability from Harvard University, is very passionate about sustainable manufacturing. Contact him at 512-800-6031, or email dtroyer@theramreview.com.
Tags: reliability, availability, maintenance, RAM, metrics, key performance indicators, KPIs, OEE

