
In last week’s article (Sept. 5, 2021, see link below), we introduced Overall Equipment Effectiveness (OEE). It’s the product of multiplying three input elements (Availability, Yield/Speed, and Quality) to arrive at a number representing the performance of equipment or a plant compared to perfection (which is 100%). This week, we look closer at the Availability component.
On the surface, the Availability component would seem to be straightforward. It can be expressed with this simple equation:

Alternatively, we could replace 8,760 hours with 525,600 minutes or 31,536,000 seconds, or an even-finer level of granularity. For example, if a plant runs 7,060 hours in a year, its Availability is 80.6%. What a simple and elegant concept. Still, many organizational leaders push back on consistently employing 8,760 as the denominator in the Availability equation.
The common argument goes like this: “We only planned to run 7,500 hours in the year, so by running 7,060, our availability is 94.1%.” That seems logical, but there’s a catch. The validity and even the viability of simple metrics like Availability topple over when both the numerator and the denominator in the ratio are variable. In other words, making both the numerator and the denominator in the equation might compel us to “cook the books,” particularly when employee evaluations, bonus plans, etc. are affected by the outcome.
Consider, for example, that we plan to run 7,000 hours in the year. In that scenario, our Availability would be 101% if we ran 7,060 hours. That’s not a good scenario for a metric that’s intended to have a maximum value of 101%.
KEEP THE METRIC TRUE, BUT ACCOUNT FOR ALL TIME
As a rule, I always recommend that the metric be kept true by fixing the denominator to 8,760 hours or some comparable unit of time at a finer level of granularity. Doing so makes trending Availability performance over time a valid and useful exercise. It also allows us to account for all our lost hours. Just because you scheduled downtime for production set-up, maintenance, or other activities certainly doesn’t mean that lost production time is lean and fails to drive a lean approach to managing the business. The approach also prevents the scenario where the bar is intentionally set low for cosmetic reasons. Last, and perhaps most important when it comes to OEE, we don’t seek to maximize Availability: We seek to optimize Availability to maximize operational profitability, as defined by Earnings Before Interest & Tax (EBIT or EBITDA). However, we still must track all our planned and unplanned unavailability (downtime) and properly categorize it as equipment-induced losses, production-induced losses, and marketing-induced losses.
ACCOUNTING FOR PLANNED UNAVAILABILITY
Most organizations plan downtime for maintenance and operational activities. What this plan looks like will vary greatly from industry to industry, and even from year to year. But these downtime requirements are fixed by the laws of physics. Indeed, there are some mandatory activities that must be completed for legal compliance purposes and also incorporated into a planned shutdown. But if we currently spend 20 hours to complete those mandatory tasks, we definitely want to avoid the scenario where the time slips to 25 or 30 hours to do the same tasks (assuming no change in compliance requirements). And we must always be looking for opportunities to reduce the completion time from 20 to 15 hours, or even 10 hours.
Table I summarizes a simple mock-up for a 5-year production plan with downtime for set-ups, changeovers, and scheduled plant-cleaning events. This plan also allows for routine maintenance shutdowns and one major shutdown in the 5-year cycle.
In this simple example, the planned availability is 88% for all years except 2023, which includes a major shutdown for completing critical planned repairs, sustaining capital projects, expansive capital projects, etc. While, highly simplified, this is how most organizations run their business. The key takeaway here is that I’ve set the planned availability to 88% (except for 87% in 2023), rather than reducing the denominator from 8,760 to 7,710 (7,620 for 2023).
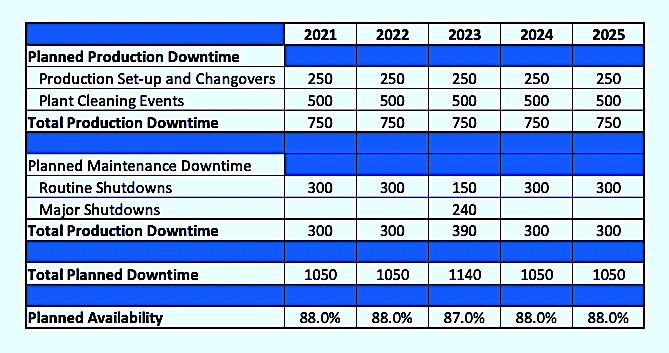
Table I. A highly simplified 5-year downtime plan.
EMPLOYING THE AVAILABILITY METRIC TO REDUCE PLANNED DOWNTIME
At first glance, you may ask, “What’s the difference? It’s the same number of production hours.” The difference lies in the psychology. If I set my denominator to 7,710 and I run 7,500 hours, my calculated Availability is 97.3%. My 20-years of schooling conditioned me to believe that a score of 97.3% equates to a grade of “A” (and a pretty darn good one to boot). However, when the denominator is fixed at 8,760 hours, the same 7,500 running hours yields an Availability of 85.6%, which is solid “B” grade, but clearly reveals room for improvement. The bottom line is that the Availability metric must objectively reveal gaps and opportunities to improve and motivate us to find them.
For example, perhaps maintenance and production teams could better coordinate the timing of their planned downtime periods. If the production team fails to provide the maintenance of a planned product changeover or cleaning event with enough advance notice, the maintenance team won’t have the time to plan maintenance work to take advantage of that opportunity. Likewise, perhaps the production and marketing teams could work together to consolidate the number of product offerings so as to reduce the number of times the plant must be shut down for product changeovers.
A ‘PITSTOP MENTALITY’ FOR PLANNED DOWNTIME
In all instances, we want to instill a “pitstop mentality” in the plant to drive a lean culture. It’s fascinating to watch pitstop crews in the racing industry. Whether your preference is Formula 1, NASCAR, or some other racing circuit, we can all agree that the orchestrated execution of a pitstop by a skilled pit crew is poetry in motion. In fact, watching a pit stop in slow motion looks more like ballet than maintenance. Each move is perfectly choreographed.
As a part of the Toyota Production System (TPS), the Toyota Motor Corp. created what it called “Single-Minute Exchange of Die (SMED).” The goal of SMED at a Toyota plant is to reduce the time required to execute product changeover activity to a single number of digits. It’s a practical template for streamlining any planned downtime activity that helps us uncover more of what’s often referred to as the “hidden plant,” i.e., production time that we can recover with better planning.
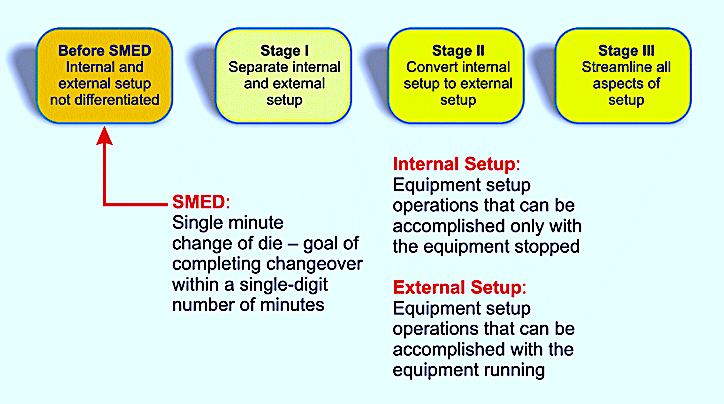
Fig. 1. Single-Minute Exchange of Die (SMED) instils a “pitstop mentality” in the plant.
As listed below, SMED principles are simple:
♦ For any planned activity, Stage I is to separate the internal ones from the external ones. Internal activities are those for which the machine must be stopped. (Sometimes this is referred to “Active Work.”) Externalactivities, conversely, can be accomplished while equipment is still running. This external preparatory work is often referred to “Front-End Loading” (FEL).
♦ Stage II is to convert internal work to external Sometimes this is simply making the decision to convert the FEL activities in lieu of waiting until the machine is shutdown and we simply failed to take advantage of the opportunity. In other instances, administrative and/or procedural changes may be required. In still other cases, equipment modifications or other engineered solutions are required for the conversion.
♦ Stage III is to streamline all aspects of the process. As an example, if one production team can complete a changeover in 15 minutes and the other production teams require 30 to 45 minutes to conduct the same changeover, conduct a Success Root-Cause Analysis (SRCA), to define and, where possible, improve, the 15-minute-team process and then standardize it across all other teams. A SRCA applies the same process as a Failure Root Cause Analysis (FRCA), but focuses on analyzing successes that we’d like to replicate in lieu of failures that we wish to eliminate.
CONCLUSION
Availability (an element of OEE) is an essential metric for asset managers. It is important enough that we chose to include it in the name of this publication: The RAM Review (for Reliability, Availability, Maintenance). But to serve us well, the sanctity of the Availability metric must be maintained by fixing the denominator to 8,760 hours. Failure to do so compromises our ability to trend Availability over time. It also creates psychological barriers that prevent the organization from striving for excellence and improvement.
This week I’ve focused on employing OEE’s Availability element to analyze, manage, and reduce Planned Unavailability (downtime). Next week’s article will discuss analyzing, managing, and reducing Unplanned Unavailability.TRR
REFERENCES
Troyer, Drew (2008-2021). Plant Reliability in Dollars & $ense Training Course Book.
ABOUT THE AUTHOR
Drew Troyer has over 30 years of experience in the RAM arena. Currently a Principal with T.A. Cook Consultants, he was a Co-founder and former CEO of Noria Corporation. A trusted advisor to a global blue chip client base, this industry veteran has authored or co-authored more than 300 books, chapters, course books, articles, and technical papers and is popular keynote and technical speaker at conferences around the world. Drew is a Certified Reliability Engineer (CRE), Certified Maintenance & Reliability Professional (CMRP), holds B.S. and M.B.A. degrees. Drew, who also earned a Master’s degree in Environmental Sustainability from Harvard University, is very passionate about sustainable manufacturing. Contact him at 512-800-6031, or email dtroyer@theramreview.com.
Tags: reliability, availability, maintenance, RAM, metrics, key performance indicators, KPIs, OEE

