
In their ground-breaking 1978 report for the U.S. Military titled, “Reliability-Centered Maintenance,” Fred Nowlan and Howard Heap discussed what was to become known as the “P-F Curve,” as well as how to use it to select optimal testing frequencies. Application of the P-F curve was further defined by NAVSEA and NAVAIR for frequency selection of testing based upon types of tests and where defects could be detected.
The use of the P-F Curve to provide guidance when inspection and predictive tools were selected was part of the overall RCM (reliability-centered-maintenance) process that Nolan and Heap described. And, with reliability engineering making enormous strides over the past 20 years, use of this curve as a technology sales tool has become increasingly widespread. Unfortunately, this has resulted in an unintended use of the concept that leaves additional concepts behind the RCM process out of focus.
(A copy of the Nolan and Heap report can be accessed at: A Review of Reliability-Centered Maintenance – MotorDoc LLC)
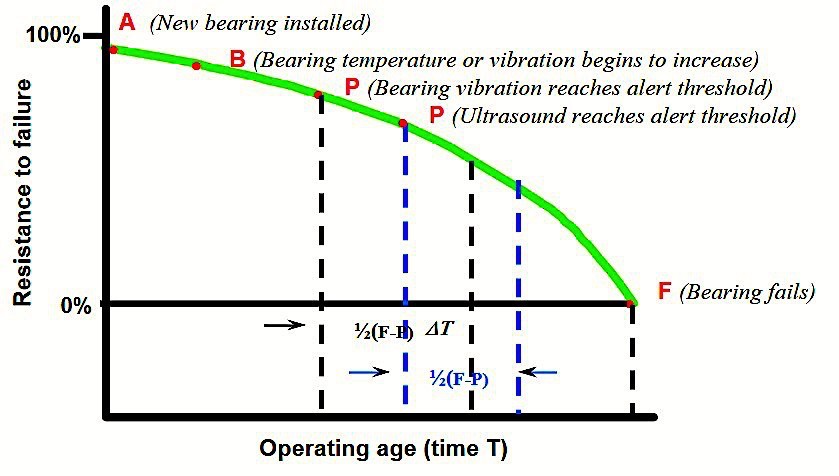
Fig. 1. Example of a P-F Curve, with the frequency selected at ½ the difference between P and F.
Data utilized for tests and inspections should be considered as data for potential engineering or process improvements. When considering maintenance inspections and tests, this type of data should be used by reliability and industrial/process engineering and management for project baselines, assessments, evaluation for modification, and root-cause-analysis. The potential impact on a system can be identified when the correct data is selected and then later analyzed for changes and modifications.
The P-F Curve can also be used to assess success of a maintenance program by determining if the frequency is effective or a new condition is identified through the maintenance effectiveness review. The interval can be adjusted, or a new method can be selected based on data that’s provided.
What is the P-F Curve? It’s the resistance to failure following a natural log curve (see Equation 1 below), to the point where the component fails, based on a measurement such as time, number of operations, distance, or related progressing factors. P is the point of fault detection, through a variety of means, after fault inception and F is the point of defined failure.

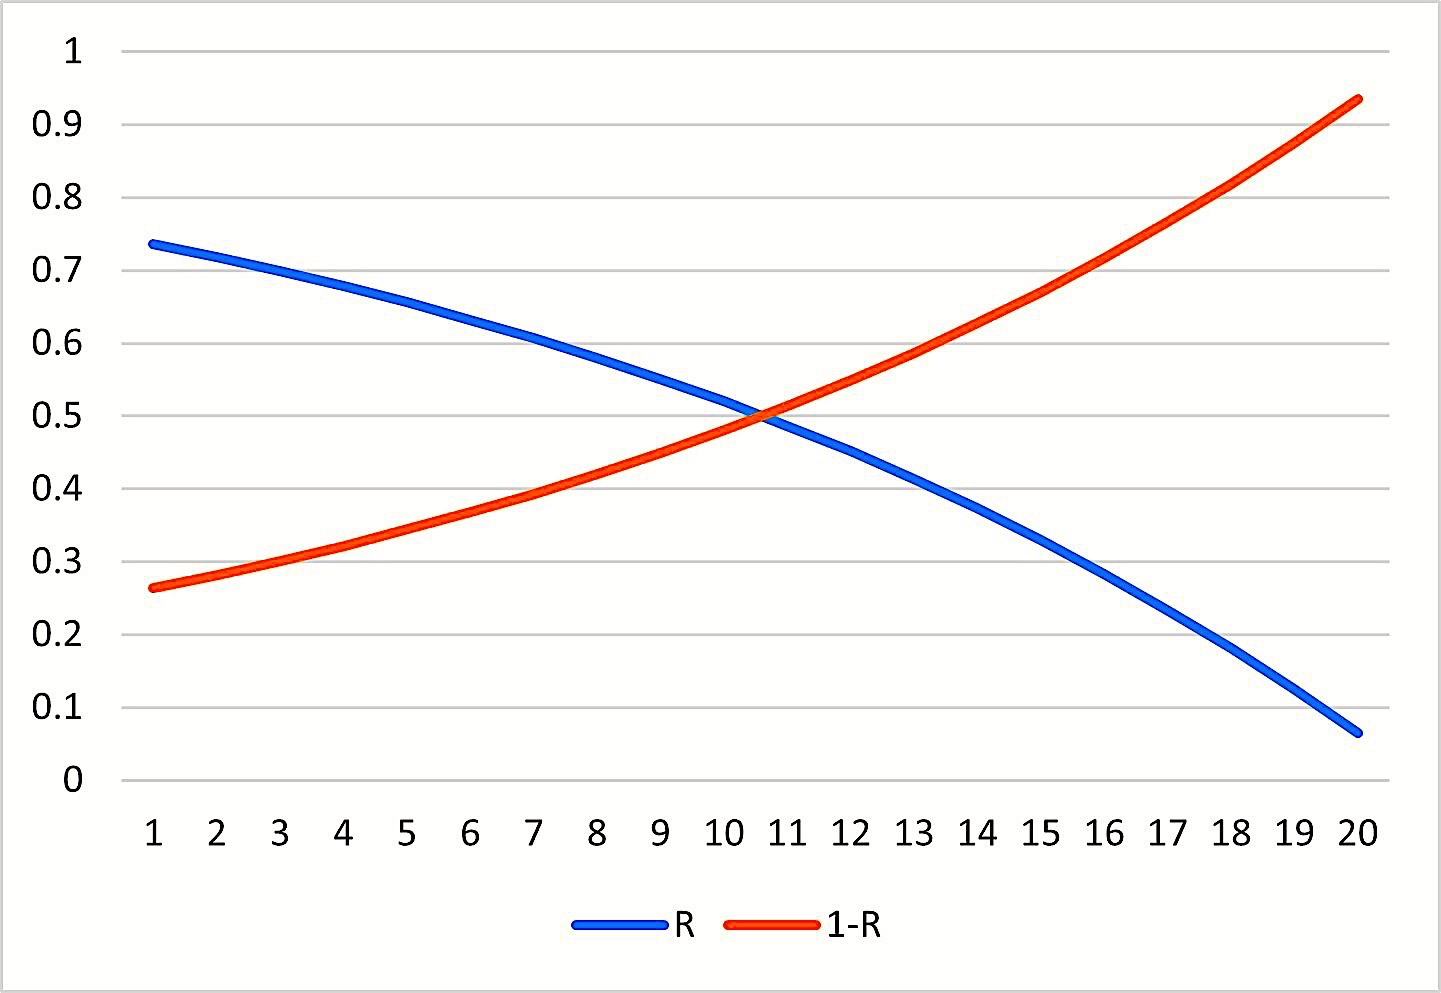
Fig. 2. The resistance to failure R and chance of failure 1-R, as we approach failure.
The other objective of the P-F Curve is to determine if modifications to equipment will change maintenance frequencies or improve the effectiveness of the system’s reliability. In this case, the probability, or risk, of conditions that can be detected are evaluated through the FMEA (Failure Modes and Effects Analysis) and then the methods used to detect faults, and the frequency of tests and inspections, that would occur after the changes can be defined.
CASE STUDY: SYSTEMS IMPACT FROM USING CORRECT DATA
From the standpoint of using correct data, studies of several electric-motor systems at a facility were conducted twice per year, using vibration, Electrical-Signature Analysis (ESA), infrared, Motor Circuit Analysis (MCA), high-voltage winding and cable analysis, and other tests and inspections. Following the upgrade of a set of medium-voltage (4160 Vac, 800 hp) variable frequency drives (VFDs), a high fifth harmonic signature was detected throughout each electrical branch, when the new VFDs were operated (Figs. 3 and 4).
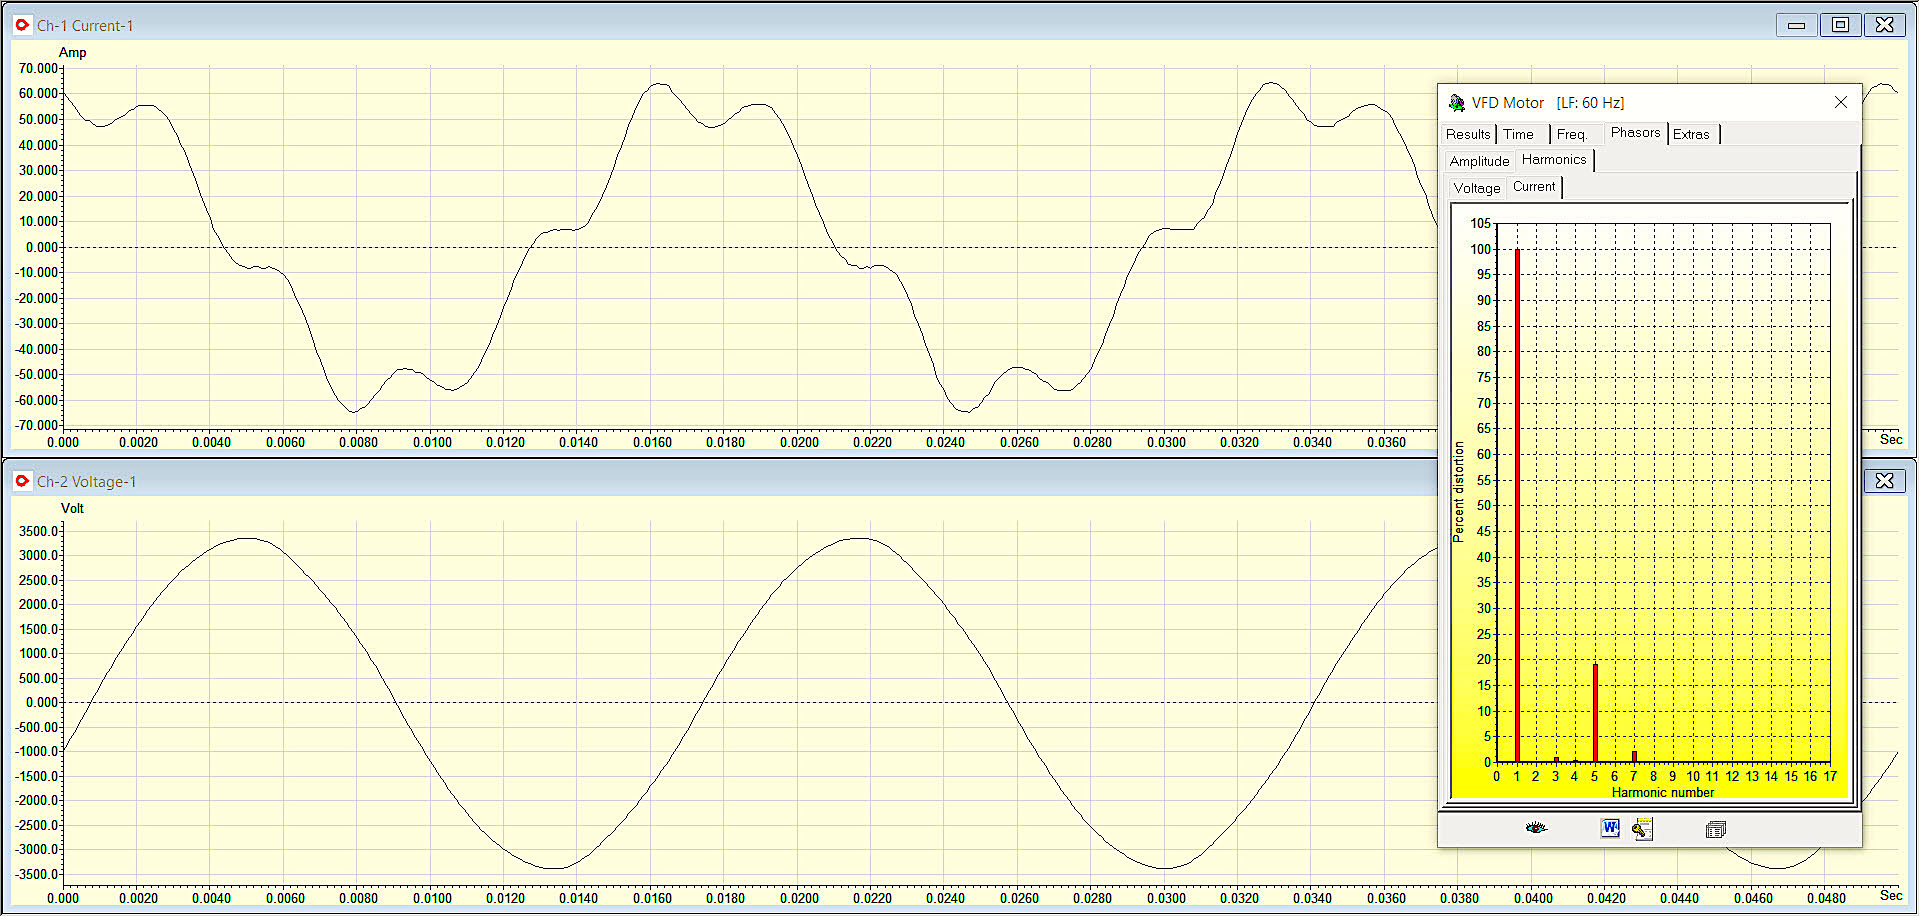
Fig. 3. Current (top) and Voltage (bottom) with Current Total Harmonic Distortion (inset)
with original 18-step medium voltage drives from EMPATH ESA Data.
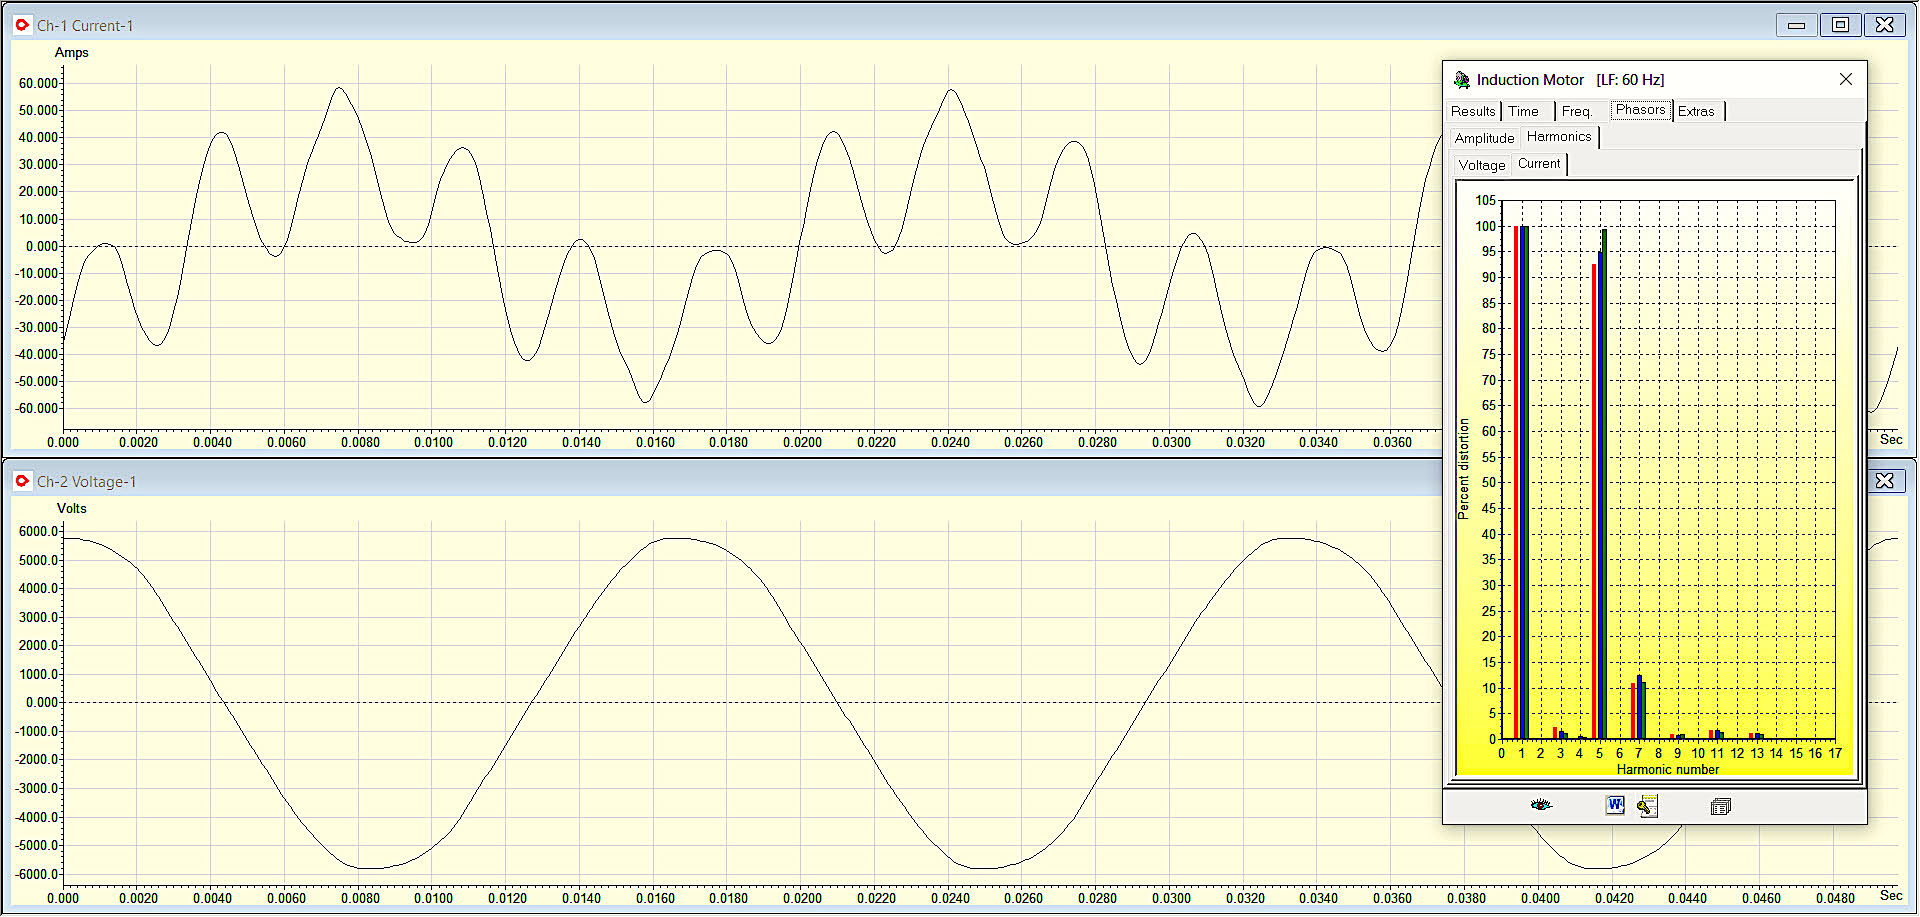
Fig. 4. Current (top) and Voltage (bottom) with Current Total Harmonic Distortion (inset)
with replacement active front-end drives from EMPATH ESA Data.
Longer starting times for motor-driven equipment in each branch that had the new VFDs operating was noted during analysis, as was nuisance tripping of the new VFDs and others throughout the plant, during large-motor startups. Branch-circuit data collected as part of maintenance testing showed occurrence of voltage drops that went from 8% for 7 seconds when these machines were not online, to 16% for 11 seconds when they were online. Based on the size of the organization and number of projects involved, without maintenance data, those troubling conditions would not have been identified and lost time would, most likely, have resulted, based on the follow-up RCFA (root-cause-failure analysis). Through identification of the electrical conditions using ESA, a short-term solution was implemented in cooperation with the drive manufacturer, while a long-term solution was being developed.
The finding was that the extremely high, but within tolerance, current total harmonic distortion caused the “True Power Factor” to fall from 0.8 to 0.3, when the machines were running in the branch. (Note: IEEE Standard 519 calls out values for Total Dynamic Distortion, which is related to the loading of the branch circuit and short-circuit limits.) The extremely low power factor resulted in a significant voltage sag that caused across-the-line large motors to start much more slowly than expected. Had that situation not been caught, it would have led to a high rate of motor repairs, drive troubleshooting and repair, and other latent conditions that may have continued for some time before being detected and corrected, if at all. This condition also would have impacted the site’s RCM program.
BOTTOM LINE
The use of the P-F Curve for the selection of testing is important, but not just for comparing how early testing technologies from various manufacturers can detect specific defects. Using this curve for selection of testing is part of a complete RCM strategy, and is meant to be applied to system and component defects associated with an FMEA.
This article has discussed applications of the P-F Curve and an example of when it is used properly, i.e., as part of an RCM program that selects the proper tools for a program, and not as a sales tool. In an upcoming article, we’ll review how using proper data tools and maintenance can help identify much larger (and industry-scale) problems that could have a national impact. We’ll also discuss a systems approach can generate greater return on investment than simple fault-finding.TRR
Click The Following Links To Read The Previous Six Parts Of This Reliability & Maintenance Opportunities Series
“Compressed Air System Efficiency” (Part 1)
“The Benefits From A Holistic Approach” (Part 3)
“Leveraging USDOE’s Energy Assessment Tools” (Part 4)
“Leveraging Industrial Assessment Energy And Productivity Tools” (Part 5)
ABOUT THE AUTHOR
Howard Penrose, Ph.D., CMRP, is Founder and President of Motor Doc LLC, Lombard, IL and, among other things, a Past Chair of the Society for Reliability and Maintenance Professionals, Atlanta (smrp.org). Email him at howard@motordoc.com, or info@motordoc.com, and/or visit motordoc.com.
Tags: reliability, availability, maintenance, RAM, P-F Curve, motor testing, Electrical-Signature Analysis, ESA, Motor-Current Analysis, MCA reliability-centered maintenance, RCM, Failure Modes and Effects Analysis, FMEA, IEEE Standard 519

