According to the U.S. Department of Energy, over 4,760 trillion Btu of steam energy represents 40% of the total energy used in industrial process applications. The efficiency of steam production by fuel ranges from 85.7% efficiency (natural gas) to 90.3% (coal) with the significant cost of energy being lost through distribution and condensate return. It’s estimated that there are over 54,000 large boilers being used by manufacturers to provide steam for industrial systems. Furthermore, over $21 billion per year is said to be spent on fueling these boilers, with chemical, food-processing, refinery, paper, and primary-metals operations representing the largest users.
To understand the financial impact of steam, it is important to calculate the cost to generate and the cost of consumption, including the pounds per hour (lbs/hr) of steam generated and used. The difference between the two are the losses associated with the steam system. While we will outline some of the steps and potential savings in this article, the U.S. Department of Energy (USDOE) has software tools and calculators in-place to perform these tasks, including fully modeling and evaluating a site’s steam system. Those calculators, along with examples, case studies, training, and other resources can be found by clicking on this link: Steam Systems | Department of Energy.
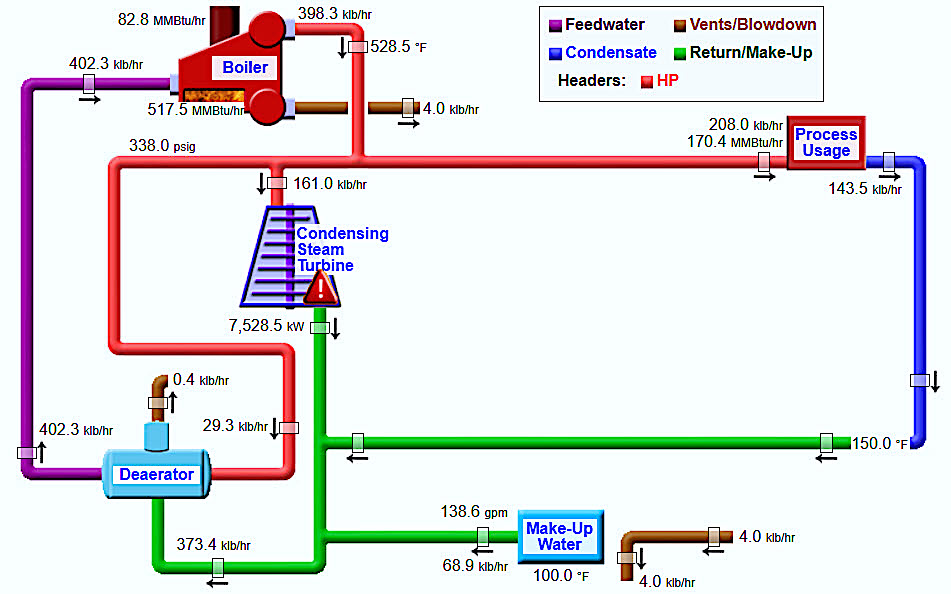
Fig. 1. Example of model built in the USDOE Steam System Modeler Tool.
Steam generation costs are more complex than determining energy costs. You need the following information:
-
-
- fuel costs
- raw-water supply
- boiler-feed water treatment
(including clarification, softening, and demineralization) - feedwater-pumping power
- combustion-air-fan (FD or ID) power
- sewer charges for boiler blowdown
- ash disposal
- environmental-emissions control
- maintenance materials and labor.
-
Strategies for Improving/ensuring boiler efficiency and keeping costs under control include both manual and technology-based methods:
-
-
- Performing frequent boiler-flue-gas analysis ensuring that oxygen, carbon dioxide, and
excess air are maintained within limits for the type of boiler and fuel. - Paying attention to flue-gas temperatures. High flue-gas temperature may reflect the
existence of deposits and fouling on the fire and water side of the boiler. The resulting
loss in boiler efficiency can be approximated by estimating that 1 efficiency point loss
occurs with every 40 F increase in stack temperature from these conditions. This value is
often trended with baselines set after boiler servicing, and a major variation in stack gas
temperature indicates a drop in efficiency and the need for either air-fuel ratio adjustment
or boiler-tube cleaning or replacement. - Monitoring burner head and orifice to ensure they are clean.
- Blowing out soot once per day from water tube boilers that burn coal or oil The Bureau of
Standards indicates that 8 days of operation can result in an efficiency reduction of 8%,
caused solely by sooting of boiler tubes. - Checking the operation of the blowdown system and making sure that excessive blowdown
does not occur. The frequency and amount of blowdown depends on the amount and
condition of the feed water.
- Performing frequent boiler-flue-gas analysis ensuring that oxygen, carbon dioxide, and
-
There can be substantial cost-saving opportunities within a typical steam system. Once you have the cost per 1,000 lbs of steam ($/klb), or in some other cost-per-measurable amount, i.e., $/MMBTU, the savings can be calculated.
The USDOE has estimated that 10% of steam traps in a system fail each year. The impact is huge, as a bad trap can allow condensate to flow through the steam system, causing energy waste, damage to equipment and related maintenance costs, and/or poor product quality.
STEAM-TRAP CASE STUDY
During a survey at a corn miller (food processing) one steam system with 37 traps was evaluated. Three of those traps were blowing through, two leaked, and two were cold plugged. This represented a failure rate of 18.9%. In addition, three locations that required steam traps did not have them. It was noted that the maintenance costs associated with steam-associated equipment in those areas was higher. At $4/klb the following was found:
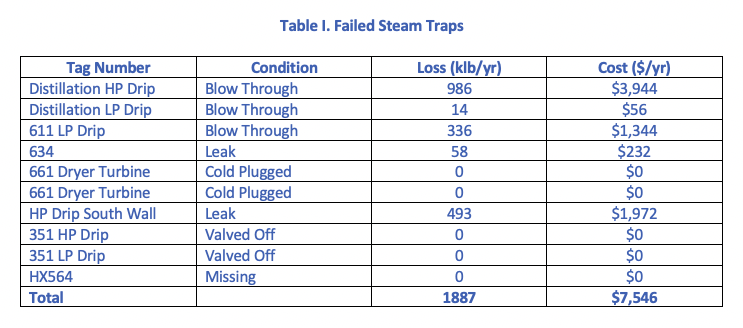
While the cold-plugged and missing steam traps show values of $0 in energy costs, the associated maintenance and repair costs were estimated at 400% greater than other turbines in the system that had functioning steam traps.
Several recommendations were made for the location including:
-
-
- Repair or replace the malfunctioning traps for an immediate payback.
- Implement an in-house testing and maintenance program and add to the CMMS.
- Increase attention to proper sizing of steam traps for all new installations.
- Install test valves or sight glasses in steam lines for visual trap testing.
-
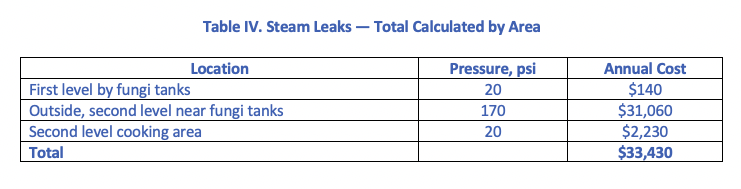
STEAM-LEAK OPPORTUNITIES CASE STUDY
At the same site as the steam-trap case study, several steam leaks were observed. The difference between steam leaks and waste steam is that steam leaks are caused by bad gaskets and valves in the steam lines. Waste steam is caused by deliberate steam exhaust through valves or other orifices.
The following tables identify the costs for various steam leaks at $4/klb derived from USDOE tables:
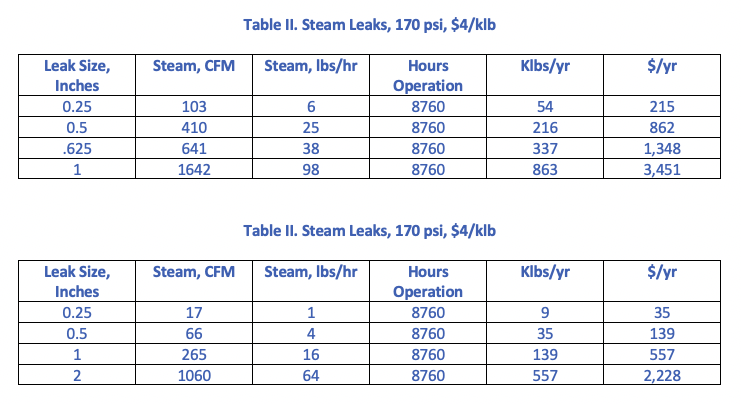
Through the walk-through survey, several steam leaks were identified, and the sizes conservatively measured. Based upon the condition of the equipment and area around the leaks, it was estimated that the leaks had been overlooked or ignored for quite some time. One department that had both high- and low steam-headers lost, conservatively, $33,430 as a result of steam leaks.
Recommendations included the following:
-
-
- Implement a steam-valve maintenance program and replace gaskets upon failure.
- Replace and repair the present steam leaks for an immediate payback.
-
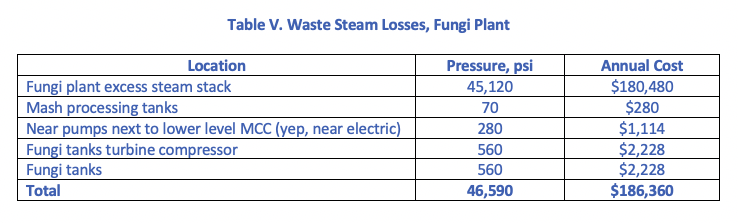
EXCESS STEAM CASE STUDY
Unlike opportunities identified in other case studies, excess steam is considered part of the “waste stream.” In this case study, at the same facility and part of the plant as the previous ones cited in this article, a significant amount of waste steam was being vented. This manifests as white plumes of condensate escaping from stacks, hoses, and other areas. The survey team found that the steam being vented was approximately 20 psi. A conservative loss estimation of excess steam through one stack located at the fungi plant was $180,480 per year (45,120 klb/yr).
There are several options for reducing waste steam:
-
-
- Replacing motors with additional steam turbines.
- Reducing the amount of steam provided to the plant.
- Recompressing steam for re-use by the system.
- Utilizing waste steam for heating, refrigeration, and air conditioning.
-
The above case studies and additional details can be found in the document, “A Novel Approach to Industrial Assessments for Improved Energy, Waste Stream, Process, and Reliability,” which is downloadable for free by clicking on the following link: A Novel Approach to Industrial Assessments – MotorDoc LLC.
GENERAL MOTORS CASE STUDY
In 2005, General Motor’s (GM’s) construction and building maintenance joint task team (UAW and management) began working with the USDOE, as part of the “Save Energy Now” program, to complete a multi-site, energy-efficiency survey. This effort followed adoption of USDOE best practices for all GM facilities in the U.S. and included use of USDOE software tools. (As noted in previous articles in this series, the “Save Energy Now” program assisted companies that met specific criteria with site surveys through third party experts supported by the USDOE. The data associated with the results was used to set up case studies and other supporting information for industry.)
The first GM site to be evaluated was the Flint Truck Assembly Plant, which had been the company’s 2001 Chairman’s Honors award-winning plant for steam systems. The survey team wanted to see if there were additional opportunities at the plant, as well as personnel with expertise in the subject to follow up on them. (Note: The site had reduced its steam usage by 21% and water consumption by 20% between 1999 and 2000.)
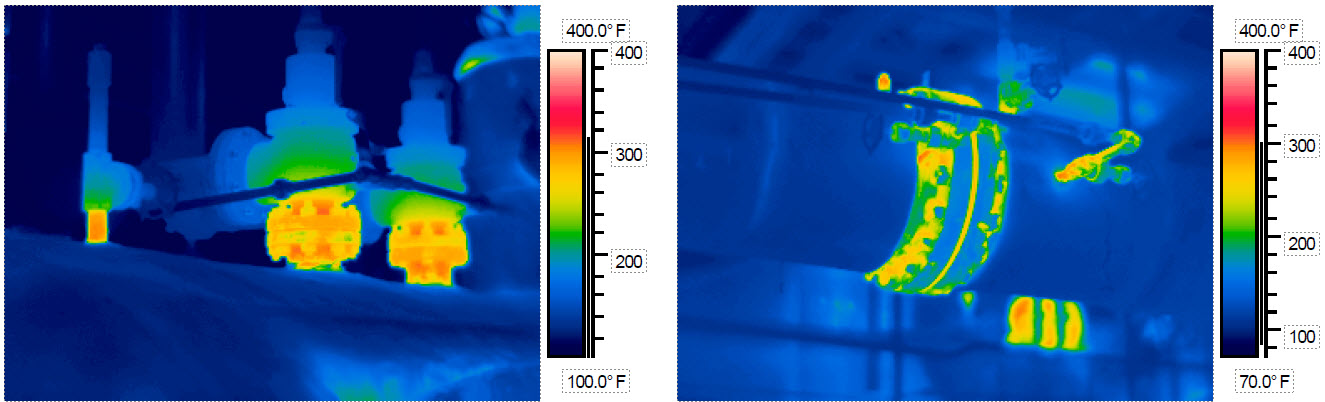
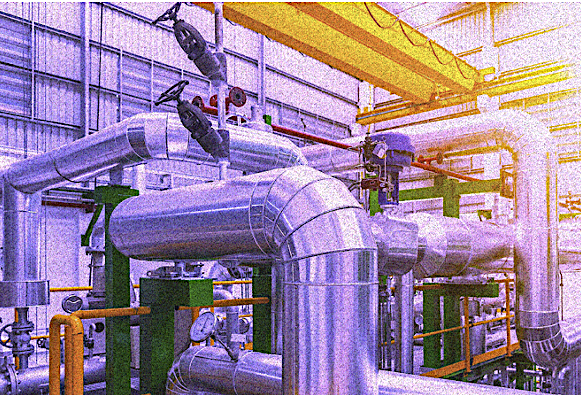
Fig. 2. Infrared scans of steam-system opportunities at GM’s Flint Truck Assembly Plant.
The 2005 survey limited the focus to two of the production lines. Performed over three days, it also included an overview of and training in the USDOE system assessment tools. The first day then consisted of a review of the powerplant system including losses from the boilers. The second and third days were spent investigating steam use throughout the facility to identify opportunities. Plant predictive-maintenance personnel used thermal-imaging and ultrasonic technologies to evaluate boiler insulation data and exposed steam and condensate return lines. The exposed lines were areas where the piping insulation was missing or lost, usually around valves. This data was entered into the models developed within the USDOE software tools to calculate savings.
Through several simple best practices, it was found that a conservative $750,000 in energy and water costs could be saved within a six-month period. A very conservative $500,000 of these savings was directly related to air-supply houses, which yielded an immediate return during the winter months. Many of the savings supported the original work performed by the facility and identified areas where continuous improvement would yield more positive results. Following this success, an additional 45+ best practices (steam, compressed air, pumping, motors) surveys were performed at GM facilities led by the joint task team.
CONCLUSION
Steam savings are not just hot air. Always significant, steam opportunities have a big impact on system reliability, maintenance, waste stream, energy costs, and production. Because of the nature of steam, the usual focus is usually on the maintenance and fuel costs associated with the boilers. But steam-distribution systems also have enormous savings potential. This article discussed and presented cases associated with some of the more common areas that can be addressed. As it has noted throughout, additional information, including documentation and software tools about these and other case studies the USDOE website, energy.gov.TRR
Click The Following Links To Read The Previous Five Parts Of This Reliability & Maintenance Opportunities Series
“Compressed Air System Efficiency” (Part 1)
“The Benefits From A Holistic Approach” (Part 3)
“Leveraging USDOE’s Energy Assessment Tools” (Part 4)
“Leveraging Industrial Assessment Energy And Productivity Tools” (Part 5)
ABOUT THE AUTHOR
Howard Penrose, Ph.D., CMRP, is Founder and President of Motor Doc LLC, Lombard, IL and, among other things, a Past Chair of the Society for Reliability and Maintenance Professionals, Atlanta (smrp.org). Email him at howard@motordoc.com, or info@motordoc.com, and/or visit motordoc.com.
Tags: reliability, availability, maintenance, RAM, energy efficiency, energy management, productivity, waste stream, steam systems, USDOE, USDOE Save Energy Now Program, Industrial Assessment Centers, IACs

