As with any story, we want to start at the beginning, and the power system provides us a story of the reliability of our facility. While hope this power looks like Fig. 1, it more often it looks like Fig. 2. Does this mean that we are looking at a feel-good romance or a campfire horror story?

Fig. 1. Voltage (bottom) and current (top) at the point of common connection at a facility.
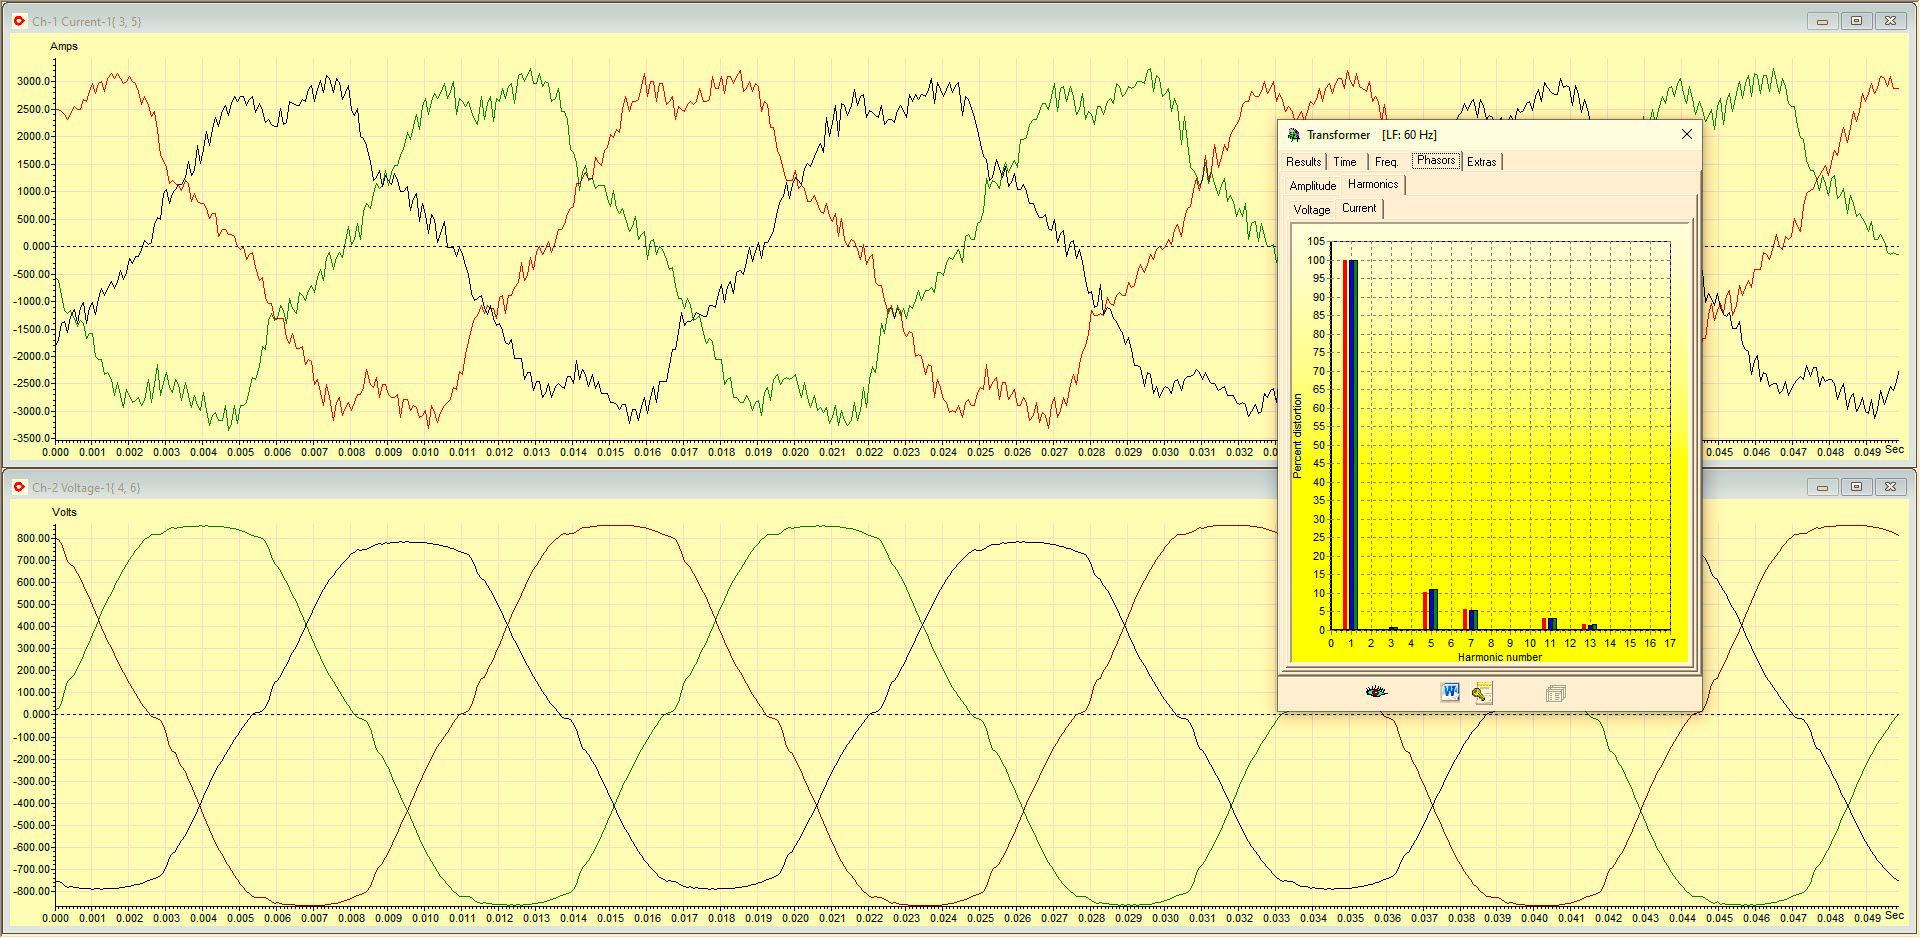
Fig. 2. Point of Common Connection (PCC) with signficant voltage and current harmonics.
Figures 1 and 2 are relatively common in commercial and industrial facilities. In fact, both of these examples are from the same company at two locations, and both describe similar electrical problems at their other facilities. What if we see current such as that shown in Fig. 3 from a similar facility?
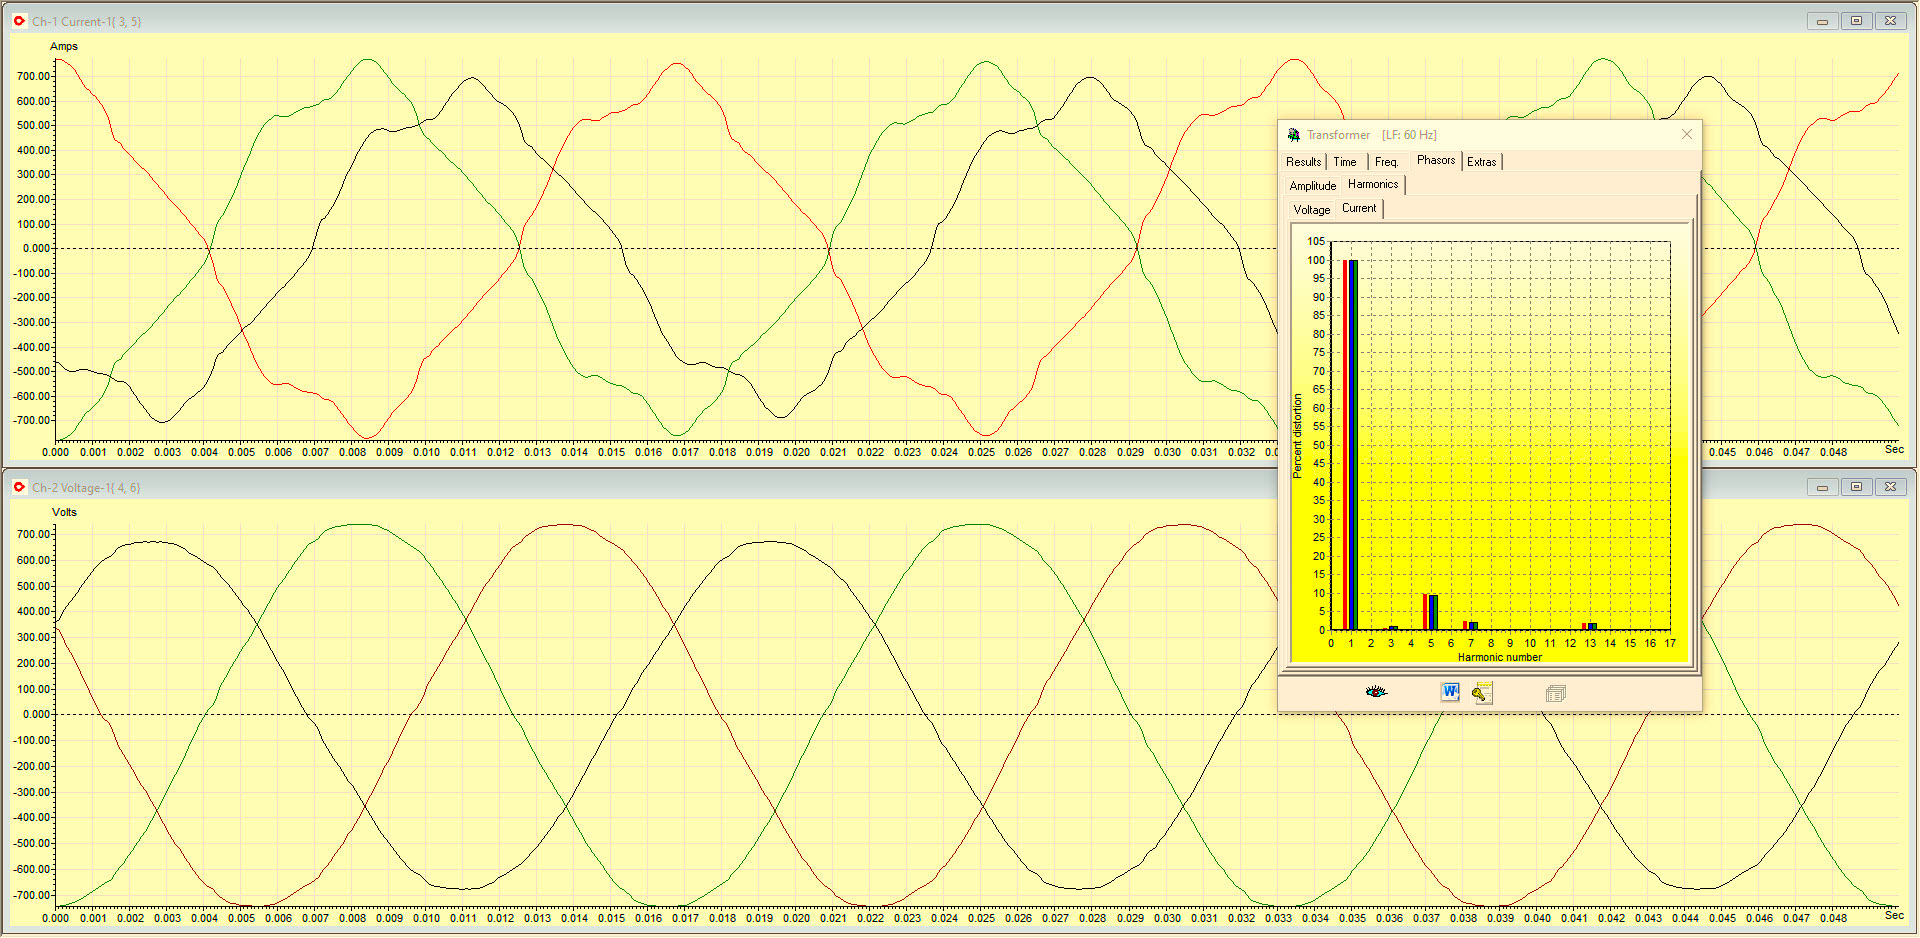
Fig. 3. Similar facility as Fig. 1 and Fig. 2, with current phase shift.
These three scenarios tell different stories about the local utility and how plant electrical reliability is addressed. In Fig. 1, the voltage is shaped correctly, and there is some harmonic content in the current. Based on the testing location, we can, at this point in time, say that the utility is performing OK, and some additional work needs to be performed on plant loads to smooth out the current waveform. However, as previously noted, this is just a snapshot in time. The story looks OK, but what happens when we take a step back and look at the same system at different time?
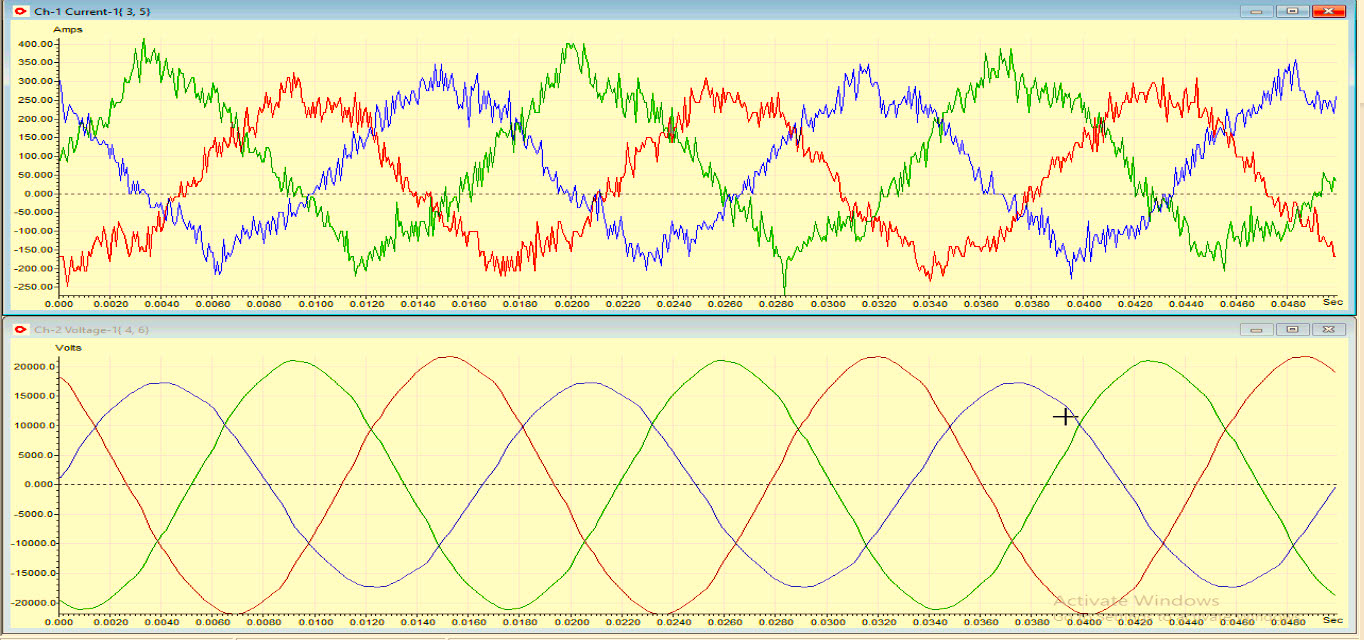
Fig. 4. Same facility as Fig. 1, at a different time of day.
In Fig. 4, the location and testing are the same as in Figure 1, but at a different time of day. This location is the same as that discussed in a previous article Seeking Reliable Incoming Power: Electrical Signature Analysis (ESA) At The Meter | THE RAM REVIEW, but the testing was done a number of months later. After a problem with the distribution line was corrected, the pattern of operation changed gradually indicating other supply issues. This once-upon-a-time feel-good story jumped the fence to summer camp horror quickly.
The electrical systems in Fig. 1, Fig. 2, and Fig. 3 are having similar equipment issues, but only Fig 1 has the severe variability shown in Fig 5 below. With this information, however, we can begin to dig in and take a look at conditions across the plants. in particular, what types of power conditioning are being applied; how are over and under-voltages being managed; what do the electrical equipment failures look like at each facility; and what do ground and neutral look like?
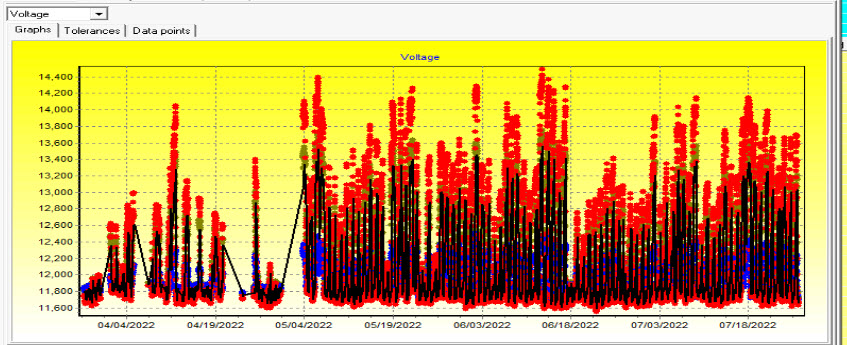
Fig. 5: Overvoltages, undervoltages, and phase unbalances when trending incoming power.
If we have reasonable records on electrical failures in-plant, we can begin to look at a broader picture. If the records are only verbal (anecdotal), we need to look past them and confirm the conditions on some sample equipment. In all of the above three cases, electronic systems were seeing problems and there were a number of “ghost” equipment trips where no determination could be made. This means that looking closer at electrical conditions as we work deeper into facilities becomes imperative in determining whether the conditions we see at the PCC are generating the failures, or if there is some other cause.
In Part V, we’ll dig deeper into a facility to see what the impact of the PCC is as we develop our story.TRR
Click The Following Links To Read Previous Installments In This Series
ABOUT THE AUTHOR
Howard Penrose, Ph.D., CMRP, is Founder and President of Motor Doc LLC, Lombard, IL and, among other things, a Past Chair of the Society for Maintenance and Reliability Professionals, Atlanta (smrp.org). Email him at howard@motordoc.com, or info@motordoc.com, and/or visit motordoc.com.
Tags: reliability, availability, maintenance, RAM, electric motors, electrical-infrastructure review, energy efficiency, industrial-energy assessments

