Electricity: Other than work performed through connected equipment, it’s invisible and rarely considered until a blackout or other dramatic event occurs. From a reliability perspective, more effort is spent on understanding the greasing of a bearing that would affect just one machine for a few hours than the condition of a primary transformer that could take down a whole facility for weeks or months.
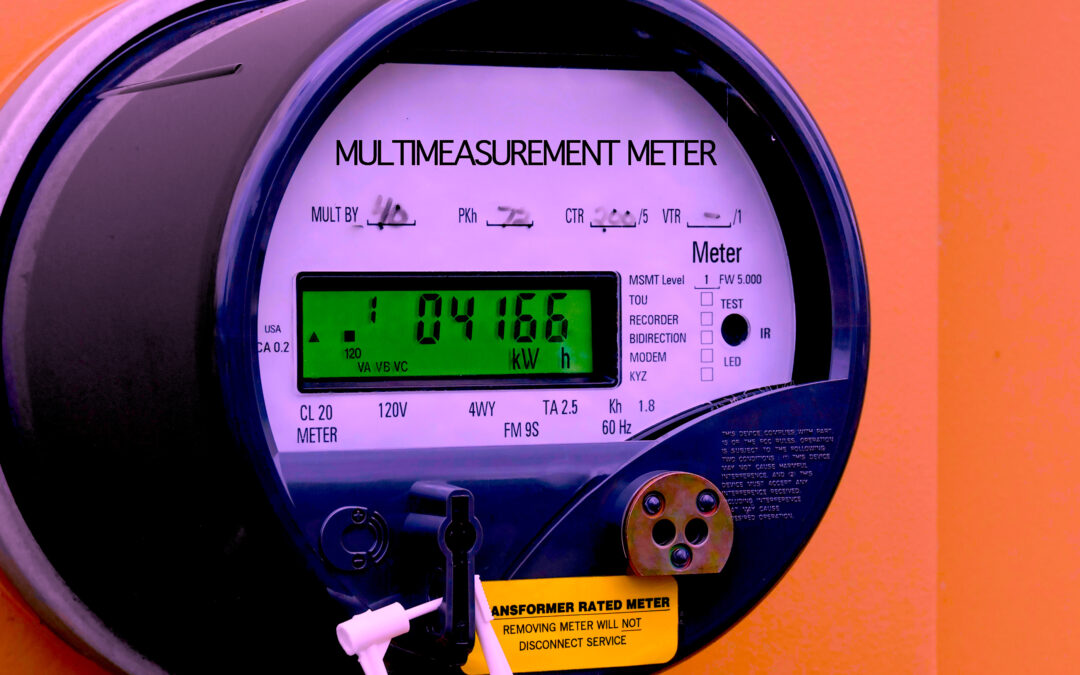
So, how much time do we take to consider effects on the power distribution and our interconnection with other plants and loads in that distribution? In this article, we provide a quick view of the application of Electrical Signature Analysis (ESA) connected to a utility meter that monitors a 3-MegaWatt, 24/7 operation. This analysis involved cooperation of the facility and utility. It also necessitated a brief plant-outage to connect the equipment based on utility-side safety rules. (Note: The tested distribution system is supplied by traditional power generation, from a large power plant a few miles away.)
THE STUDY
Data was collected via an air-gapped server for about 45 days, with alerts set up to identify any unusual conditions. The incoming voltage over that time is shown in Fig. 1.
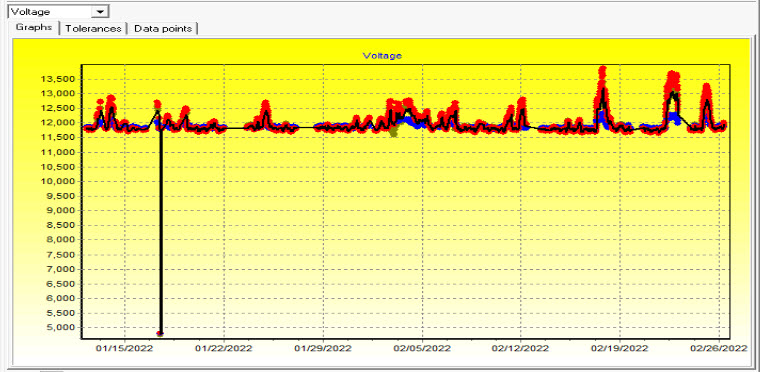
Fig.1. Incoming power rated at 12,470 Volts AC to primary of transformers.
As noted in Fig. 1, the voltages showed highs, lows, and some other unusual conditions. Within 24 hours of drafting this article, we noted one of these conditions as shown in Fig. 2.
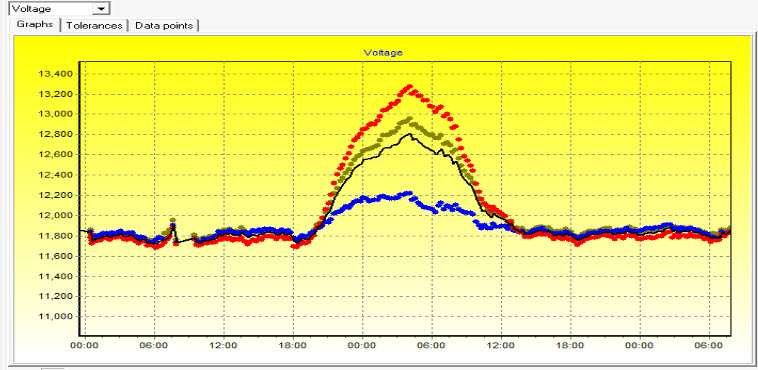
Fig. 2. Voltage unbalance over a 15-hour period.
Gold is Phase 1, Blue is Phase 2, Red is Phase 3, and Black is the average.
As noted in Fig. 3, the voltage unbalance hit a peak of 4.7% ((12669 V – 12070 V)/12669 V) coming into the plant. Electric machines and other three-phase loads can normally manage a 5% voltage-phase unbalance. Internal distribution systems will have their own unbalances that may drive this value higher or lower than 4.7% at each load in a plant. Outside of direct utility-customer agreements, there’s no requirement for recording this type of condition and during the monitoring period it occurs several times per week.
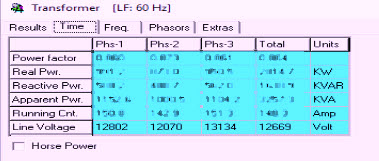
Fig. 3. Voltage values from 0400 (4am).
Then, during adverse weather in the month of February, another troubling condition was detected. The data was reviewed, and extreme voltage harmonic conditions were detected as shown in Fig. 4.
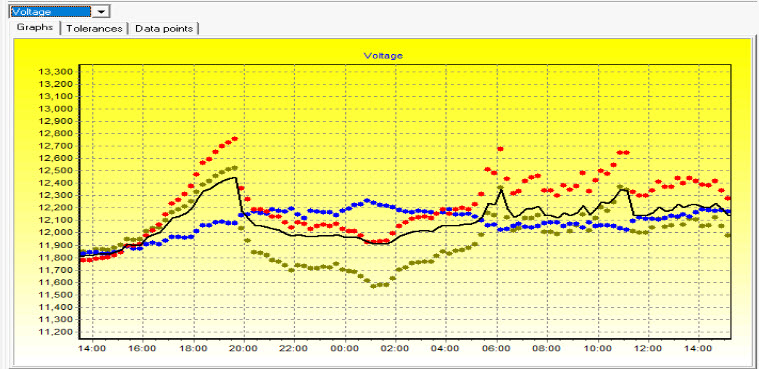
Fig. 4. Unusual voltage patterns and harmonics prompted an alert.
The voltage harmonics in one phase were extreme, as shown in Fig. 5 and Fig. 6, prompting a review of operating conditions within the plant. The utility representative was also notified and, while conditions continued, an investigation was prompted.
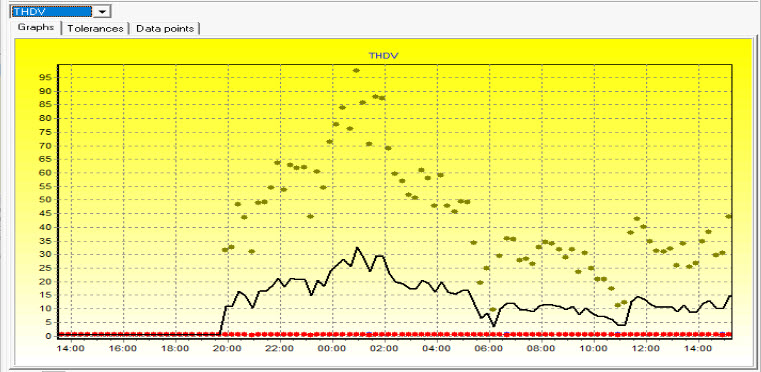
Fig. 5. Total voltage harmonic distortion in Phase 1.
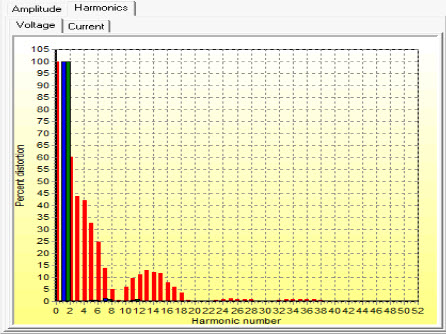
Fig. 6. Voltage harmonic distortion Phase A (Phase 1).
The voltage waveform was reviewed from the ESA device, as shown in Fig. 7, and indicated a brief short between phases in every cycle. These shorts continued over a 24-hr. period. It was determined that there was an issue with a 69kV line or, based on previous experience, that there could be an issue with capacitors in the distribution system.
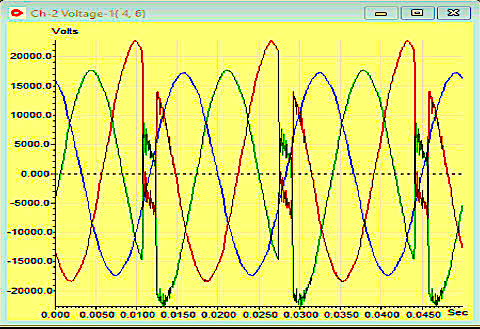
Fig. 7. Phase shorts every cycle.
A quick review, as shown in Fig. 8, indicated that plant personnel would have been completely unaware of these conditions, as there were no changes to normal production. (Similar conditions had been found for shorter periods of time during the monitoring period.)
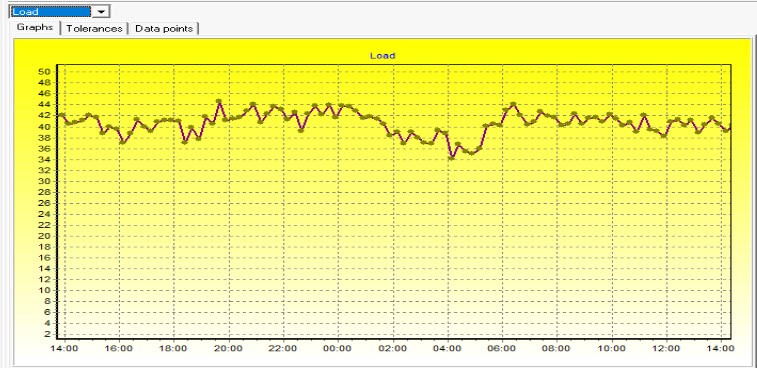
Fig. 8. Steady electrical loading during the event.
CONCLUSION
The conditions described in this article weren’t unusual during the ~45-day monitoring period at the facility (which maintains an older utility-distribution system combined with a traditional power-generation supply). Voltage unbalance and incoming voltage conditions were undetected by relays. Some conditions may have been filtered by the facility transformers. However, each condition had a direct impact on the probability of latent damage or degradation to electrical equipment in the plant.
Voltage unbalances and other conditions may also have been the direct result of other plants located in the immediate area, as both new (“green”) and traditional power generation provides balanced phases and primarily clean power. Challenges occurred through the transmission and distribution of that power and the variety of measures implemented by neighboring plants on the same grid. Those measures included the addition of such things as variable frequency drives (VFDs), unbalanced loads, and other power strategies.
From the utility side, an aging transmission and distribution system combined with new types of generation and customer loads results in rapid degradation of components. That scenario leads to other concerning power conditions. Understanding these conditions and mitigating them through power conditioning and working with the utility can have a dramatic positive impact on electrical reliability. Ignoring those conditions, though, will lead to increased operating costs and outages at our plants and facilities.
Using the ESA device on the utility side of the power supply provided information that is not typically monitored or viewed. This gave us the ability to dig into the conditions at the point of common connection between the utility and facility. In these situations, we provided information back to the utility on conditions for which it was unaware.TRR
ABOUT THE AUTHOR
Howard Penrose, Ph.D., CMRP, is Founder and President of Motor Doc LLC, Lombard, IL and, among other things, a Past Chair of the Society for Maintenance and Reliability Professionals, Atlanta (smrp.org). Email him at howard@motordoc.com, or info@motordoc.com, and/or visit motordoc.com.
Tags: reliability, availability, maintenance, RAM, electricity, incoming power, electrical-power generation, electric meters, Electrical Signature Analysis, ESA

