
In the world of maintenance, we check and measure many things. We do so primarily to recognize and evaluate changes in the desired state of an item or system that’s being monitored and maintained by a preventive-maintenance (PM) program. Ideally, the PM checklist uses a Go/No-Go Check against a set condition requirement, described by each checklist item on the PM work order. (For more details, see my article, “Make Work Orders WorK: The Work Instruction,” link below.)
If, for some reason, the PM is not performed or not completed, the work order must be closed in the management system as “Incomplete.” This helps alert the maintenance department as to the number/percentage of PMs fully completed. But it only tells a small part of the story. The bigger, more important part of the story is why the PM wasn’t completed, who was responsible for the incompletion, and what the ramifications of the incomplete PM work were (and are)?
Click Here For The Referenced Aug. 29, 2020, Article,
“Make Work Orders Work: The Work Instruction”
The power of performance measurement lies in its ability to tell the type of story that allows a plant’s current approach to maintenance or machine use to be verified, supported, or improved upon. Referring to the simple PM completion example described above, a single “incomplete” event on a monthly report would not deliver a compelling maintenance or management story unless context were added.
PUTTING CONTEXT IN YOUR PERFORMANCE MEASUREMENTS
The first element of context is to identify if a report is for a single machine, a group of the same type or manufacturer, a production line, or is plantwide in scope, i.e., all machines.
The second element of context is to identify the reason why the PM could not be completed on the work order, and then code this reason into the work-management system for later recall and ease of reporting. Typical codes could include, among other things: Lack of parts (maintenance planning related); Lack of access (stakeholder/client related); End of shift and no time to complete (maintenance scheduling related).
The third element is to set a target state and determine if and how often it is being met through trend plotting over a set period of time. Combined with dates and/or date ranges, this data can be correlated with other data to unfold any underlying machine or behavior problem(s) that must be managed.
Figure 1 depicts a real-world example from an automotive stamping plant that tracked its combined stamping-press PM work completion by month, over a 12-month period. As the figure shows, the PM completion rate was lowest in October (87.5%), and gradually improved by the following August (to 96%). But it never reached the desired 100% target state.
From a maintenance perspective, Fig. 1 only tells us that PM completion improved considerably over the 12-month period and was trending toward the target state. It doesn’t spell out the reason(s) for incompletion; the obvious improvements that were made; or the impact of the improvement(s). This “story” requires additional research and explanation if the performance indicator is to have meaning
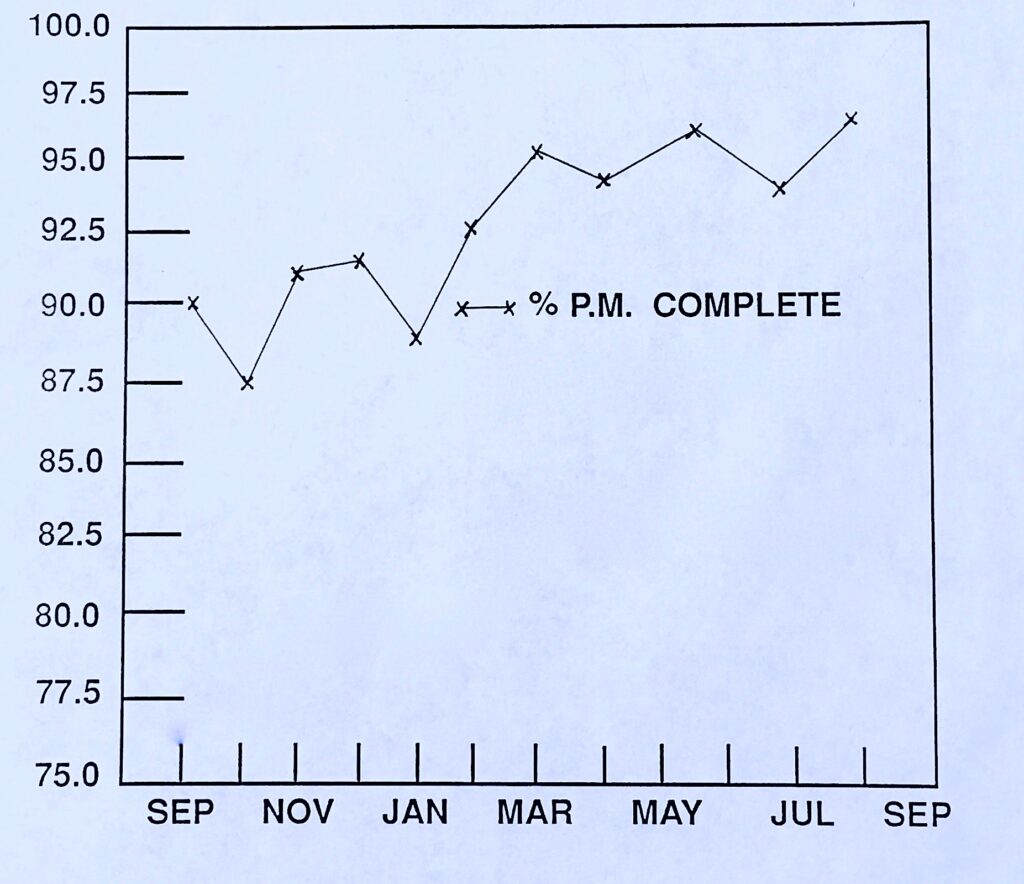
Fig. 1. All stamping press % PM-Completion trend graph.
In this stamping plant example, the PM completion results were for all presses combined, as defined in the graph title. Conversations with production-department personnel revealed that they measured OEE (Overall Equipment Effectiveness) to track and benchmark their efficiency against sister plants. OEE examines the relationship between machine availability, production throughput, and production quality. (Learn more about the OEE metric from Drew Troyer’s three most recent articles for The RAM Review, see links below.)
Further discussion revealed that the production operation was experiencing significant first time quality problems on machine startup and die changeover (see Fig. 2).
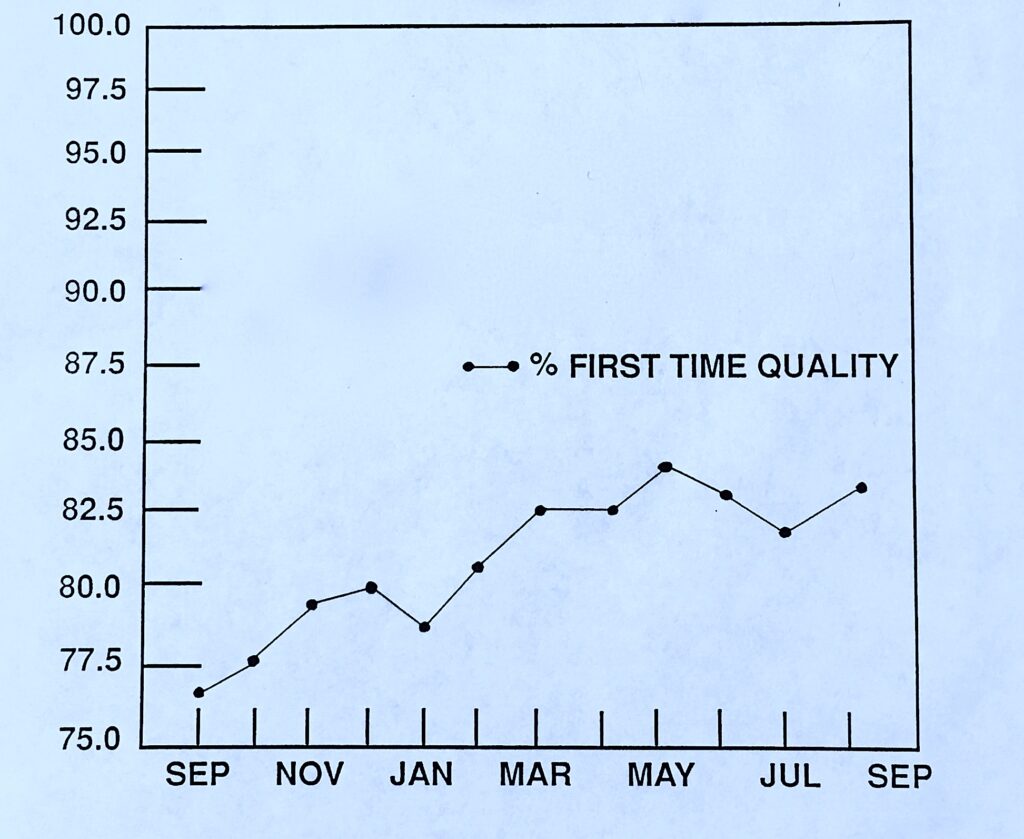
Fig. 2. All-production-stamping-press % First-Time-Production-Quality trend graph.
When maintenance laid the % First-Time-Production-Quality trend measurements against % PM-Completion trend measurements for the same period, an immediate correlation-impact was evident. Figure 3 shows an almost identical parallel trend of the two graph plots.
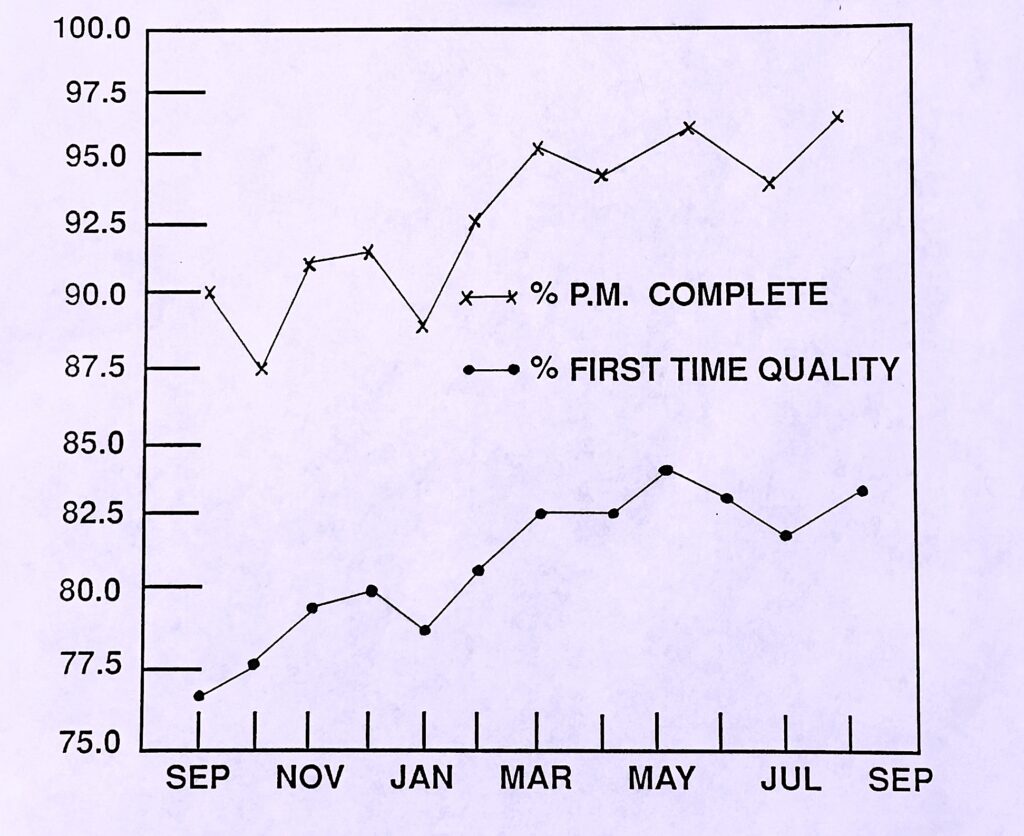
Fig. 3. All-production-stamping-press % PM Completion and
% First-Time-Production-Quality comparison trend graph.
At first glance, Fig. 3 tells the story that the First-Time Production Quality is directly related to PM Completion. The root cause goes further. In this case, the majority of PM incompletion was not a maintenance-related issue. It was, instead, a stakeholder issue resulting from production denying maintenance access to the machine while trying to play catch-up on reduced throughput numbers due to First-Time-Production-Quality issues. The improvement strategy was clear: Improve scheduling and access to the machine to complete PM requirements, and First-Time Production Quality would improve significantly.
THE FINAL WORD
The remarkable parallelism between the two trends tells a good story: that the PM being performed in this case was on track and highly effective. It also illustrated, in a meaningful way, that when quality maintenance is completed, it has a direct effect on machine availability, and a direct/indirect impact on production throughput and product quality.
The power of contextual performance measurement can’t be ignored. The question is, do your performance measurements tell the most compelling story possible?TRR
Click The Following Links For The Referenced OEE Articles By Drew Troyer
“Lagging Indicators For Asset Management: OEE (Overall Equipment Effectiveness”)
“Lagging Indicators For Asset Management: OEE’s First Element (Availability)”
“Lagging Indicators For Asset Management: OEE’s First Element (Availability, Part 2)
ABOUT THE AUTHOR
Ken Bannister has 40+ years of experience in the RAM industry. For the past 30, he’s been a Managing Partner and Principal Asset Management Consultant with Engtech industries Inc., where he has specialized in helping clients implement best-practice asset-management programs worldwide. A founding member and past director of the Plant Engineering and Maintenance Association of Canada, he is the author of several books, including three on lubrication, one on predictive maintenance, and one on energy reduction strategies, and is currently writing one on planning and scheduling. Contact him directly at 519-469-9173 or kbannister@theramreview.com.
Tags: reliability, availability, maintenance, RAM, asset management systems, work orders, planning and scheduling
.

