
The first part of this two-part article (see link below) addressed the basics of Mean Time Between/To Failure (MTBF/MTTF), which is one of the most fundamental performance metrics for reliability engineering. To recap: in Part 1, I discussed the fact that MTBF/MTTF represents the average, a measure of central tendency. As noted in that article and a previous one (see link below), average can be a dangerous number: Without a measure of variability about the average, the MTBF/MTTF metric can be misleading and fuel incorrect decisions. I also discussed the importance of evaluating risk profiles over time.
In this week’s article, we’re delving deeper into MTBF/MTTF to help users improve the metric’s ability to support effective asset management decisions that drive asset reliability up and life-cycle cost of ownership down.
Click The Following Links To Read The Previous Articles
“MTBF/MTTF (Mean Time Between/To Failure), Part 1” (Aug. 15, 2021)
“As A Metric, ‘Average’ Can Be A Dangerous Number” (May 15, 2021)
MACHINES ARE TOO COMPLEX FOR A SINGLE AVERAGE
Despite the apparent elegance of MTBF/MTTF as a metric (largely because of its simplicity and ease of calculation), it may not always support informed and effective asset-management decisions and associated actions. Previously, I discussed the fact that the failure rate sometimes decreases, sometimes remains constant, and sometimes increases as a function of running time/cycles/distance.
Adding to that complexity, most assets and systems of assets are very complex and subject to a wide array of failure modes. The ISO 14224-2016 standard offers an excellent framework for collecting reliability data. The standard is written for the petrochemical industries, but I find it highly applicable and adaptable to any industry.
Reliability and asset-performance data can and should be collected at both use/location and equipment subdivision levels (Fig. 1). ISO 14224 suggests collecting use/location data at the industry, business category, installation, plant/unit, and section/system levels. Data collected at this level will likely inform general business-related metrics and not necessarily asset reliability related.
However, when one drops down to the equipment subdivision foundation of the ISO 14224, equipment-asset-reliability metrics become of paramount importance. An asset can experience failures at the equipment unit, subunit, component/maintainable item, and/or the part level. In terms of driving effective decisions, collecting data at all levels is important, but for driving asset reliability its very important to correctly collect and stratify the equipment/subdivision data levels. MTBF/MTTF for an asset at the at the equipment unit level could be driven by a wide range of factors.
For example, a sales and marketing team might have committed to a product configuration that exceeds the operating capacity of the equipment, which could lead to a marketing-induced failure. Or a plant might experience a power outage or disruption of its raw-material supply-chain, which could disrupt production (the equipment is failed). However, the solutions in those cases don’t reside at the equipment-asset reliability level. Thus, including that data into our failure rate and subsequent MTBF/MTTF calculations would have a muddling effect.
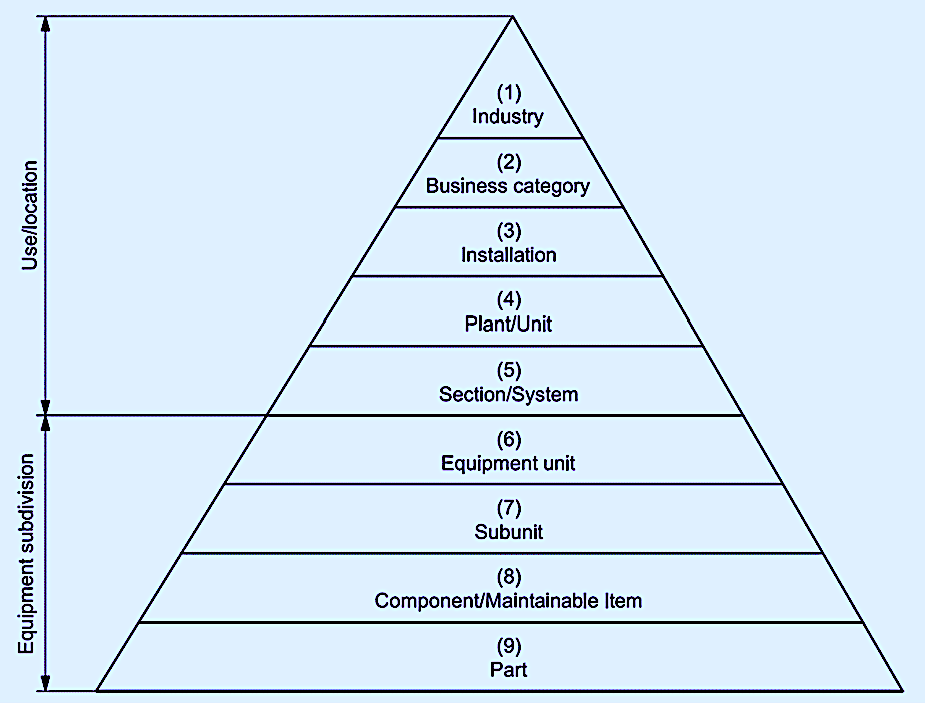
Fig. 1. Asset reliability data collection pyramid from ISO 14224:2016.
INCORPORATE GRANULARITY INTO EQUIPMENT SUBDIVISION ANALYSIS
Even at the equipment subdivision level of data collection, MTBF/MTTF can be extremely variable. Consider the case of a centrifugal pump, which resides at the component/maintainable item (level 8) on the ISO 14224 hierarchy.
A centrifugal pump is comprised of an impeller, volute, shaft, bearings, inlet pipe/flange, outlet pipe/flange, seal/packing, base, foundation, coupling, etc. And it is coupled to and driven by a motor that includes its own various components and motor-control center (MCC). Moreover, the pump may also include auxiliary systems, such as an external lubrication system. There’s quite a lot going on, even with basic assets in the plant. Component/maintainable items (level 9) on the hierarchy can experience a wide range of different failure modes as can the parts from which they’re constructed. Take, for example, the volumes of books and articles written just about the many failure modes of rolling-element bearings.
When they’re all lumped together, the failure modes at the equipment-subdivision level result in a failure rate and associated MTBF/MTTF metric so random and variable that it is all but useless in supporting asset-management decisions. Granted, it’s always great to see MTBF/MTTF increase. But if you lack clarity about which forcing functions are driving the improvement, it’s hard to determine if that improvement is a by-product of smart, effectively executed asset-management decisions or just dumb luck.
Additionally, when failure data is lumped together, it also produces a randomizing effect on the risk profile as a function of time. Referring to Fig. 2, if we combine failure modes A, B and C, which exhibit an early-life pattern, with failure modes D, E and F, which exhibit a wearout pattern, the system failure rate flattens out to a constant failure rate after the run-in period. It appears that the entire system has a constant failure rate when, in reality, only failure-mode G exhibits the constant-failure-rate pattern.
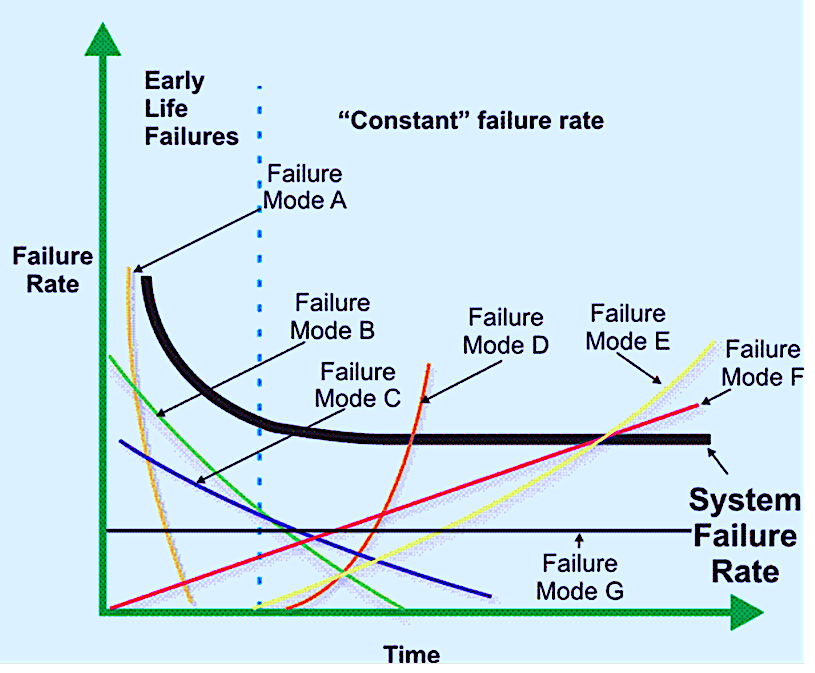
Fig. 2. Combining failure data from different components, parts, and
failure modes has a “randomizing” effect on the data.
This randomizing effect of combining data at the equipment unit, subunit, component/maintainable item, and part levels in the ISO 14224 standard makes decisions very challenging, especially when different failure modes are at play. So, taking things one step further, I advise you to collect data and calculate the failure rate and MTBF/MTTF at the failure-mode level as well. Ideally, you’ll collect this data utilizing a standardized taxonomy of failure modes.
The IEC 60812 standard for conducting Failure Modes & Effects Analysis (FMEA) offers an operational-level taxonomy of functional failure modes that can serve as a good starting point (Fig. 3). At a technical- failure-mode level, the ISO 14224 standard offers taxonomical guidance at the component/maintainable-item level. For mechanical components, I’ve always leaned heavily on the Naval Surface Warfare Center’s (NSWC) Handbook of Reliability Prediction Procedures for Mechanical Equipment. I refer to this 522-pg. book daily. It can be downloaded for free (see link in the References section below).
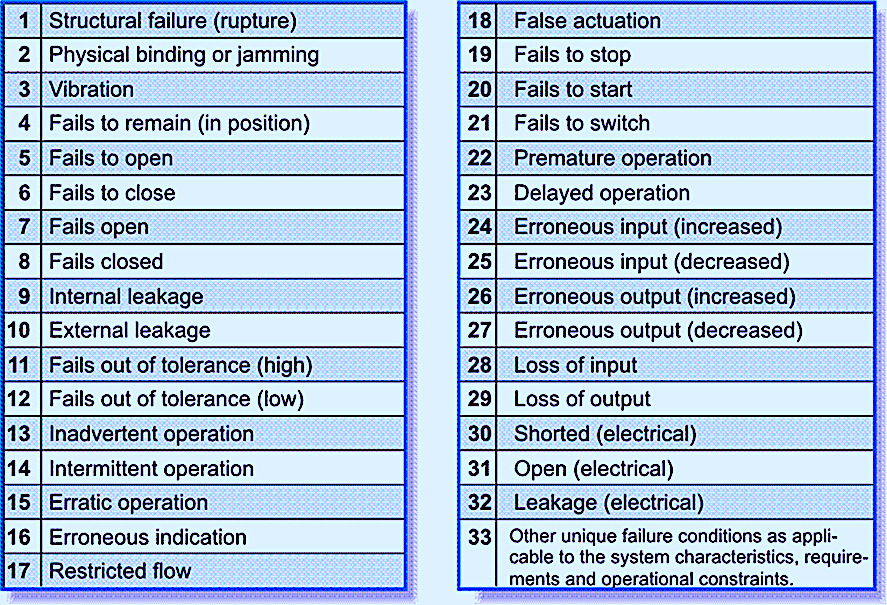
Fig. 3. Example taxonomy of functional failure modes from IEC 60812.
FOR ADVANCED PLAYERS ONLY
So far, we’ve discussed data collection to support the calculation of failure rates and MTBF/MTTF at the functional, component/maintainable-item, and part levels. The concept can be driven down to monitoring the MTBF/MTTF at the root-cause level. Monitoring our performance at the root-cause level is extremely helpful in driving proactive behaviors in the plant. Monitoring the average time between various root-cause excursions is advanced reliability engineering and asset management.
Tracking the MTBF.MTTF for root-cause conditions will require your organization to regularly engage in Apparent Cause Analysis (ACA) and Root Cause Analysis (RCA). The first method, ACA, is a simple, scaled-down cause analysis process that we employ on a daily basis. Why-Why analysis or Five-Why analysis is a great example of ACA that should be engrained in your continuous-improvement culture. RCA is reserved for more complex and impacting events and near-misses. The difference is ACA generally employs linear logic by successively asking the question why enough times to arrive at a satisfactory root cause.
With RCA, we start with a universe of all possible causes and begin to systematically eliminate those that we know didn’t contribute to the event in question. That leaves us with a manageable set of root causes that we know contributed to the event in question or that we can’t logically eliminate.
Whether conducting ACA or RCA, it’s helpful to employ a standardized taxonomy of failure cause. I’ve always found the taxonomy defined in DOE NE 1004:1992 to be a good one (Fig. 4). This is the standard guide for conducting root-cause analysis in the nuclear-power industry. It’s also fully applicable to any RCA investigation. As is the case with the NSWC book on mechanical reliability, this RCA guide was created by the U.S. Government Department of Energy (DOE) and is available for free download and unlimited distribution (see link in the References section below).
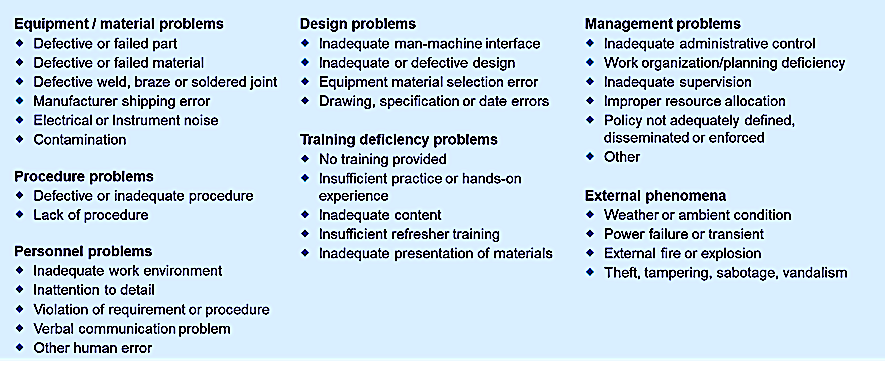
Fig. 4. Standard taxonomy of failure causes as defined in DOE NE 1004:1992.
CONCLUSIONS
Our two-part article on the topic has rigorously examined Mean Time Between/To Failure (MTBF/MTTF). As a lump sum at the use/location level, its usefulness for driving effective asset-management decisions is limited and questionable. As a metric, its usefulness increases at the equipment subdivision level and particularly at the component/maintainable-item-and-part levels.
Note, however, that due to the complexity of plant-equipment systems and processes, it is necessary to parse this metric at the failure-mode level to ensure we understand the forcing functions leading to improvement or decline in MTBF/MTTF performance. To effectively compile data at this level requires sophisticated data-collection hierarchies and taxonomies. Highly sophisticated organizations collect data at the root-cause level to track the average time between excursions in the control of a failure-root-cause condition.
Next week we’ll tackle Mean Time To Repair (MTTR).TRR
REFERENCES
ISO 14224:2016. Petroleum, petrochemical and natural gas industries – Collection and exchange of reliability and maintenance data for equipment. International Organization for Standardization. Geneva, Switzerland.
IEC 60812: 2018. Failure modes and effects analysis (FMEA and FMECA). International Electrotechnical Commission. Geneva, Switzerland.
Naval Surface Warfare Center (2011). Handbook of Reliability Prediction Procedures for Mechanical Equipment. http://everyspec.com/USN/NSWC/download.php?spec=NSWC-11_RELIABILITY_HDBK_MAY2011.055322.pdf
DOE NE 1004:1992. DOE GUIDELINE – ROOT CAUSE ANALYSIS GUIDANCE DOCUMENT. https://www.standards.doe.gov/standards-documents/1000/1004-std-1992/@@images/file
ABOUT THE AUTHOR
Drew Troyer has over 30 years of experience in the RAM arena. Currently a Principal with T.A. Cook Consultants, he was a Co-founder and former CEO of Noria Corporation. A trusted advisor to a global blue chip client base, this industry veteran has authored or co-authored more than 300 books, chapters, course books, articles, and technical papers and is popular keynote and technical speaker at conferences around the world. Drew is a Certified Reliability Engineer (CRE), Certified Maintenance & Reliability Professional (CMRP), holds B.S. and M.B.A. degrees. Drew, who also earned a Master’s degree in Environmental Sustainability from Harvard University, is very passionate about sustainable manufacturing. Contact him at 512-800-6031, or email dtroyer@theramreview.com.
Tags: reliability, availability, maintenance, RAM, metrics, key performance indicators, KPIs, MTBF, MTFF, Naval Surface Warfare Center, NSWC, ISO 14224:2016, IEC 60812: 2018, DOE NE 1004:1992

