
This week, we continue our exploration of metrics and key performance indicators (KPIs) that support effective management of equipment assets in manufacturing, process, and other heavy industries. Here, our focus is on the balance sheet. But first, some recapping is in order.
In my recent article on Return on Net Assets (RONA), I explained it as the income statement (profits) divided by the balance sheet. RONA performance is driven by increasing operating profits and leaning out the balance sheet (see link below). In my subsequent article on the Economic Value Added (EVA) KPI (see link below), I stated that investors provide the organization with funding to run and/or grow the business. But those funds are free. Investors expect returns that exceed the Weighted Average Cost of Capital (WACC). Most of the invested funds wind up on the organizations balance sheet, which is the focus of this article.
Click The Following Links To Read The Referenced Articles
“Return On Net Assets (RONA):
The Ultimate Test Of Asset Management” (Feb. 6, 2022)
“Going Beyond Accounting Profit & RONA:
Economic Value Added (EVA”) (Feb. 14, 2022)
Note: Most organizations utilize financial accounting practices that incorporate depreciation, amortization, etc., for tax purposes, and management or cost accounting processes that drive business decisions. In this article, I’m limiting my discussion to management accounting.
BALANCE SHEET BASICS
For most manufacturing and process industry companies, the primary balance-sheet elements of interest to asset managers involve Replacement Asset Value (RAV) of the plant and equipment and inventory. The sum of the plant and its equipment and inventory on hand add up to the Net Operating Asset in Place, or NOAP (Fig. 1). Real property, material resources and intangible assets such as patents, secret formulae, etc,. are excluded from the equipment-asset managers’ accounting of the balance sheet. Let examine a mining company as an example.
The financial performance of a mine comes down to good geology and effective asset management. If the geology is not right, the mine has no reason to exist. If the geology is right, then the enterprise’s ability to create value for shareholders and other stakeholders is determined by its ability to convert those resource reserves into profit by effectively and efficiently extracting, separating, treating, and concentrating the material. As equipment-asset managers, we have no influence over the quality of the resource reserves.

Fig. 1. Replacement Asset Value (RAV) and Inventory on Hand are the balance-sheet
elements that make up the Net Operating Asset in Place (NOAP).
They should be of interest to asset managers.
THE PLANT AND ITS EQUIPEMENT
Arguably, the most important balance sheet element for the equipment asset manager is the plant and its equipment. We usually describe this in terms of RAV. In financial accounting, assets are affected by depreciation and amortization. The Replacement Asset Value reflects the true value of the plant and its equipment in present-dollar value that, in turn, reflects the time value of money relative to the WACC.
For example, referring to Table I below, suppose that we want to build a new greenfield plant. Investors provide us with $1 million to do so in what we’ll call year zero. Let’s say that we have operated the plant for 10 years. At the end of that 10-year period, the RAV of the initial investment is nearly $1.8 million, assuming a 6% WACC. The value compounds annually at that rate. As a note, if we decided to simply charge a rate of inflation of 2.5% annually, the RAV would be around $1.3 million.
On the other hand, most plants require further investment for upgrades and major refurbishments that are often incorporated into shutdown/turnaround/outage (STO) or other major maintenance events. This is generally called sustaining capital investment. Referring again to Table I, let’s assume that we required sustaining capital investments of $100,000 in years 3 and 6, and $150,000 in year 9, for a total of $350,000. If we charge the time value of money at the 6% WACC, the value of all sustaining capital investments at the end of year 10 totals $435,611.
Finally, let’s suppose that business is good, and we decide to make an expansive capital investment of $500,000 in year 7 for the purpose of adding capacity or expanding the plant’s product offering. At the end of year 10, the value of that investment has increased to $595,508, due to the time value of money at the 6% WACC rate.
In total, $1,850,000 has been invested in the plant and its equipment. However, the total sum of the initial greenfield investment, sustaining capital investments, and the expansive capital investment are worth $2,821,966 (the estimated RAV) at the end of year 10.
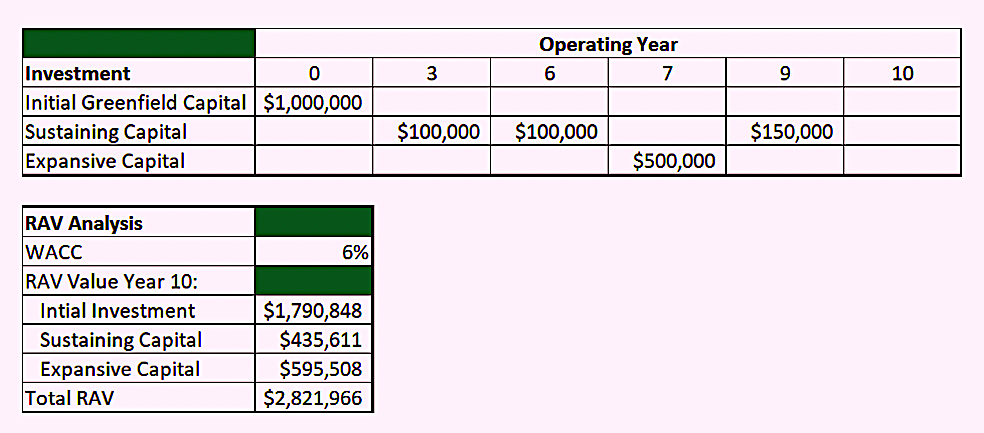
Table I. A present-value-based approach to estimating a plant’s
Replacement Asset Value (RAV).
There are other approaches to estimating RAV. Some organizations simply use the insured value of the plant and its equipment. Others use a dynamic bottom-up, engineering-based approach to estimate the cost to build the plant in the current market. I find the insured value to be overly simplistic and the bottom-up, engineering-based approach to be overly complex.
KEEP A LEAN BALANCE SHEET
As explained in my Feb. 6, 2022, article on RONA (see link above), from a mathematical perspective, the fastest way to increase the reliability of a production process is to have two machines, when you only need one to achieve your production goals. To restate, assume that a process pump has a predicted reliability of 90% over some defined operating period and context. If you have a standby pump with the same 90% reliability, as a process, the pumping function’s reliability increases to 99%. If you have two standby pumps to mitigate the potential failure risk of the primary duty pump, the reliability increases to 99.9% (Fig. 2).
Although the math is simple, the standby pump doubles the equipment investment and increases operational costs associated with maintenance. And having two standby pumps triples the required investment. But standby pumps only mitigate unreliability risks, they don’t increase a plant’s production output. In financial terms, the balance sheet (NOAP) grows, but revenue and associated profits don’t. RONA, i.e., the income statement divided by the balance sheet, suffers as a by-product.
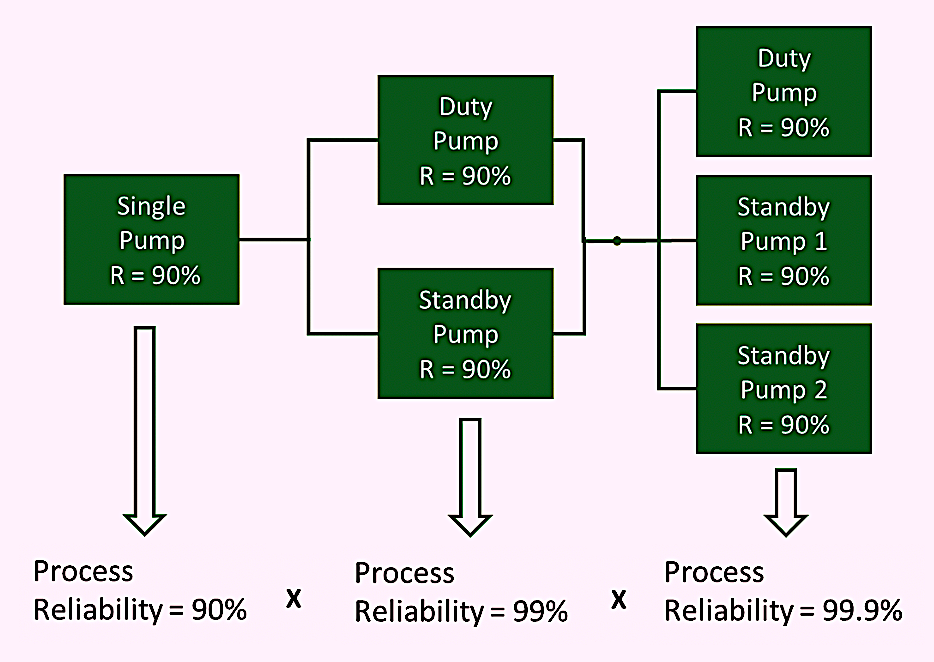
Fig. 2. Redundancy is mathematically the fastest way to increase process reliability,
but it’s a very costly option.
The enlightened and frugal RAM professional strives to improve plant and process reliability by implementing proactive measures to increase the base reliability of primary systems. He or she recognizes that redundant systems, while mathematically effective at mitigating operational risk, actually fatten the balance sheet and compromise RONA performance. So, those of us in the RAM arena should be employing redundancy very sparingly and very strategically to maintain a lean balance sheet and assure RONA performance.
CONCLUSIONS
As explained previously, Return on Net Assets (RONA) is the ultimate determinant of asset-management performance. Again, RONA is the calculated by divided the income statement (profit) by the balance sheet. If the balance sheet is fat, RONA suffers. While the fastest way to improve reliability is the deployment of redundant systems, i.e., having two or three machines when you only need one, that redundancy fattens the balance sheet and compromises RAM performance.
In an upcoming issue of The RAM Review, we’ll tackle inventory management. It’s the other major balance-sheet element that’s in a RAM professional’s circle of control and influence.TRR
REFERENCE
Troyer, Drew (2000-2020). Plant Reliability in Dollars & $ense Coursebook. (Editor’s Note: This coursebook accompanies the author’s four-day workshop on the subject.)
ABOUT THE AUTHOR
Drew Troyer has over 30 years of experience in the RAM arena. Currently a Principal with T.A. Cook Consultants, a Part of Accenture, he was a Co-founder and former CEO of Noria Corporation. A trusted advisor to a global blue chip client base, this industry veteran has authored or co-authored more than 300 books, chapters, course books, articles, and technical papers and is popular keynote and technical speaker at conferences around the world. Drew is a Certified Reliability Engineer (CRE), Certified Maintenance & Reliability Professional (CMRP), holds B.S. and M.B.A. degrees. Drew, who also earned a Master’s degree in Environmental Sustainability from Harvard University, is very passionate about sustainable manufacturing. Contact him at 512-800-6031, or email dtroyer@theramreview.com.
Tags: reliability, availability, maintenance, RAM, key performance Indicators, KPIs, Replacement Asset Value, RAV, Return on Net Assets, RONA, Economic Value Added, EVA, Overall Equipment Effectiveness, OEE

