
For most of 2021, my articles for The RAM Review focused on the various metrics and key performance indicators (KPIs) for equipment-asset management. I started with a series on proactive leading indicators such as Overall Vibration Effectiveness (OVE) and Overall Lubrication Effectiveness (OLE). Then I turned my attention to mean-time-between/to-failure (MTBF/MTTF) and mean-time-to-repair (MTTR). Finally, I provided a 12-article series on Overall Equipment Effectiveness (OEE). All of those KPIs reflect performance on the plant floor and, if they’re employed properly, can drive successful behaviors. (These articles and others under my byline can be quickly accessed through the following link.)
Click Here To Find The Author’s Referenced Articles On Metrics And KPIs
For the next several months, I’m going to target financial metrics that reflect our effectiveness as physical asset managers. I’m beginning this journey with Return on Net Assets (RONA). RONA is commonly referred to as a measure of management effectiveness. From an accounting perspective, RONA is literally the income statement divided by the balance sheet. When one looks up details about a publicly traded stock, he or she will usually find Return on Assets (ROA) and Return on Equity (ROE) under the heading of “Management Effectiveness.” RONA is very similar to ROA. The primary difference is that ROA is based upon the book value of the company’s assets, while RONA is based upon an estimate of the current market value of the assets.
RONA, along with the closely associated KPI of Return on Capital Employed (ROCE) drive value for company owners. In fact, RONA is a very important component of company valuation, as well as a major driver of demand and price for publicly traded stocks. Let’s explore this important KPI from the perspective of physical-asset management.
RONA BASICS
The owners of publicly traded or privately held companies in the manufacturing, process, mining, and other asset-intensive industries invest money to build plants and buy, among other items, equipment, supplies, and services, for manufacturing processing, or extracting things of value. And they expect to make a profit on their investments.
That profit is generally defined as RONA. It’s calculated by dividing the firm’s earnings before interest, tax, depreciation, and amortization (EBITDA) by the replacement asset value (RAV) of the plant and its equipment plus inventory on hand, which represents the Net Asset. RAV is used in lieu of book value to achieve temporal equivalence. For example, it would be inaccurate to evaluate 2022 profits relative to an investment made in 2001.
On the surface, RONA is a relatively simply metric to calculate which is part of its appeal. Probably the most difficult part is determining the RAV for the plant and inventories. It can be challenging to estimate these values in present values. Some organization utilize the insure value as an estimate for RAV. Some use the purchase value plus some compounding rate to reflect inflation. For example, a plant that cost $10 million to build 20 years ago would be worth $14.85 million in today’s dollars, assuming a 2% rate of inflation. The combined total of RAV and inventory on hand is referred to as the Net Operating Asset in Place (NOAP). Real property is typically excluded from the RAV and RONA calculation.
RONA IMPLICATIONS FOR RAM PROS
In a nutshell, RAM professionals are responsible for delivering operational reliability and uptime and low operational costs. In my series on OEE, I noted that your next percentage point of OEE gained is more profitable than your last one. The reason is simple: A plant requires a certain number of OEE percentage points to cover the fixed costs of operation. Table I illustrates this point. In this graphic, I’ve created an imaginary company presented under three asset management scenarios: 1) the lower-quartile asset manager; 2) the average asset manager; and 3) the upper-quartile asset manager.
As Table I shows, the lower-quartile performer in my example achieves an operational availability of 80% and a yield/speed of 75%. I’ve assumed 100% quality, which results in an OEE of 60%. I’ve assumed that the lower-quartile performer achieves $1 billion in sales. By contrast, the average asset manager in my example achieves an availability of 85% and a yield of 80% for an OEE of 68%. These extra eight percentage points of OEE push the average asset manager’s sales to just over $1.13 billion. The upper-quartile asset manager in my example achieves sales of $1.275 billion based upon availability of 90%, yield/speed of 85% and an OEE of just over 77%.
In all the above scenarios (low, average, and high), sales equals about $16.7 million per OEE point. However, the profit picture is very different. The lower-quartile asset manager achieves profit of $65 million, or about $1.08 million per OEE point, whereas the upper-quartile performer that leverages the NOAP more effectively, achieves profits of $1.42 million per OEE point. That’s because, despite proportionally higher cost of goods sold (COGS) and asset management costs (which are set to 23.5% of sales), the fixed cost of $100 million is distributed across a much greater number of production unit sold for the upper-quartile scenario. As a result, the lower-quartile performer delivers an anemic 5.7% RONA compared to 7.6% RONA for the average-case and 9.6% RONA for the upper-quartile performer.
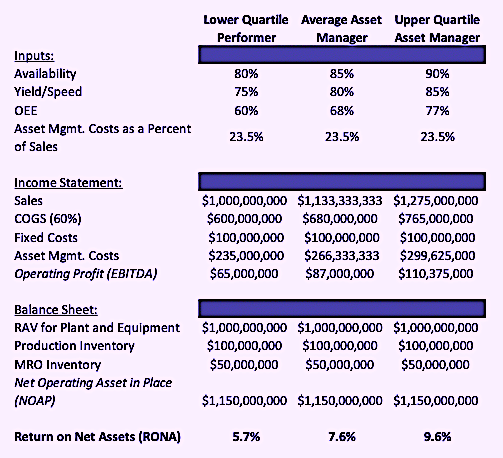 Table I. RONA comparison under three different levels of asset-management effectiveness.
WAIT: THERE’S MORE
In addition to driving profits and RONA performance through improved OEE, upper-quartile managers generally come up with lower operating costs and often have leaner asset bases and inventory levels, which further improves profitability and RONA. As a reliability engineer, I can say that, mathematically, the fast way to improve operational reliability is to have two assets when you only need one.
If, for example, a process pump has a calculated operational reliability of 90%, and the operator installs a standby, the duty-standby combination achieves a calculated reliability of 99%. If you have three pumps but only need one, the reliability jumps to 99.9%. The math really is simple. The problem is that the NOAP for the plant grows, which also causes maintenance costs to increase.
This concept is extended to inventory, too. It’s generally accepted that Maintenance, Repair and Operations (MRO) inventory has a carrying cost of 22% of value per year due to the cost of capital, shelf-degradation, obsolescence, pilferage, space, systems, people for management, and the like. Lean operators use just-in-time (JIT) inventory practices, whereby materials arrive just as they’re required to minimize time on hand. JIT demands reliability. Unfortunately, if a plant and its assets are unreliable, MRO stores tend to expand with plenty of “just-in-case” inventory. What’s worse, that type of “We need parts and material on hand just in case something fails” scenario basically means “We are planning to fail.”
In a 2009 study, The Aberdeen Group (now Aberdeen, aberdeen.com) found that lower-quartile asset managers spent more on maintenance and sustaining capital than their upper-quartile counterparts. Their research also found that lower-quartile performers spent 23.5% of sales on asset management as opposed to 17.2% for their upper-quartile performers.
When we plug in those asset-care costs, a slight reduction in the RAV of the plant due to reduced dependency on standby systems and a somewhat leaner MRO-inventory value, we can begin to see the full value of world-class equipment-asset management that’s shown in Table II. The upper-quartile performer’s profit is nearly triple the profit of the lower-quartile performer. And, with a leaner balance sheet due to a lower NOAP, the upper-quartile performer achieves more than three time the RONA value with 18.3% vs. 5.7% for the lower-quartile performer.
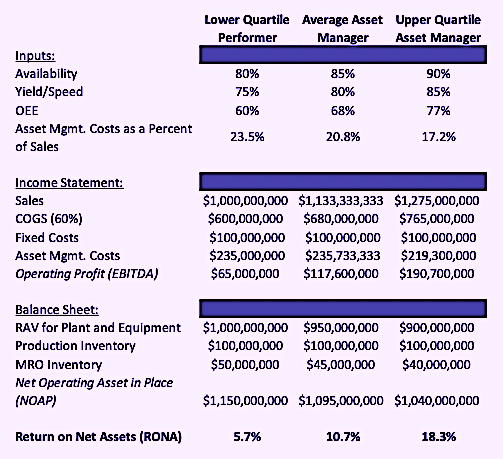 Table II. The combined effect of increasing OEE, reducing asset cost, and leaning the NOAP.
CONCLUSION
In this article, we’ve introduced Return on Net Assets (RONA), a high-level measure of management effectiveness. In the simplest of terms, RONA is a company’s income statement divided by its balance sheet. It’s a major driver of a company’s valuation.
RAM professionals have a major impact on RONA. As I’ve explained here, we can profoundly impact RONA performance when we push overall equipment effectiveness OEE up; proactively drive asset-management costs down; and reduce redundancy and maintenance, repair and operations (MRO) spares.
In my next article, I’ll expand upon this week’s discussion about RONA by addressing economic value added (EVA), which is an economic profit, as opposed to a simple accounting profit. EVA is frequently the basis of company analysis and executive bonus schemes.TRR
REFERENCES
Shah, M. and Littlefield, M. (2009). “Asset Performance Management: Aligning the Goals of CFOs and Maintenance Managers.” The Aberdeen Group. November.
ABOUT THE AUTHOR
Drew Troyer has over 30 years of experience in the RAM arena. Currently a Principal with T.A. Cook Consultants, he was a Co-founder and former CEO of Noria Corporation. A trusted advisor to a global blue chip client base, this industry veteran has authored or co-authored more than 300 books, chapters, course books, articles, and technical papers and is popular keynote and technical speaker at conferences around the world. Drew is a Certified Reliability Engineer (CRE), Certified Maintenance & Reliability Professional (CMRP), holds B.S. and M.B.A. degrees. Drew, who also earned a Master’s degree in Environmental Sustainability from Harvard University, is very passionate about sustainable manufacturing. Contact him at 512-800-6031, or email dtroyer@theramreview.com.
Tags: reliability, availability, maintenance, RAM, leading indicators, lagging indicators, KPIs, Return on Net Assets, RONA, Return on Capital Employed, ROCE, OVE, OLE, MTBF/MTTF, MTTR, OEE

