
In my Feb. 6, 2022, article for The RAM Review (see link below) I addressed the important key performance indicator (KPI) Return on Net Assets (RONA). A measure of management effectiveness, RONA is calculated by dividing an organization’s income statement by its balance sheet. It represents the ratio of the firm’s profits, as measured by earnings before interest and taxes (EBIT) or earning before interest, tax, depreciation, and amortization (EBITDA), and Net Operating Asset in Place (NOAP). This, in short, is the sum of the replacement asset value (RAV) of the plant and working inventory on hand.
Note: The higher the RONA, the more effective the management team is at creating value for the enterprise. On the flip side, RONA fails to consider the cost of capital required to earn those profits. This is where Economic Value Added (EVA) comes into play. EBIT, EBITDA, and RONA all present an accounting profit, whereas EVA presents an operation’s economic profit.
As RAM professionals, we can greatly affect an equipment-asset-intensive company’s economic profitability. In this article, I’ll provide a primer on EVA versus accounting profitability and connect the dots to Overall Equipment Effectiveness (OEE) and equipment-asset management.
EVA IN A NUTSHELL
Let me explain: An accounting profit is simply calculated by subtracting costs from revenue. Generally, the operating profit (EBIT or EBITDA), which is a management accounting measure, does not consider tax implications. But it’s what we typically use to measure management effectiveness. While the RONA metric is quite powerful, it fails to consider the cost of capital.
Investors provide capital to management based upon their belief that the team can generate a reasonable profit with the invested funds. But much like a loan from your local bank, these funds aren’t free.
Investors expect a minimum return that’s based upon their perceived riskiness and potential volatility of the business model. If the investment opportunity is believed to be very risky and/or volatile, they’ll expect a greater return. For brand-new start-up investments, so-called “angel investors” may demand a very high return. As the business proves its viability, though, the required return generally decreases. Of course, these rates are also affected by macroeconomic conditions that impact the overall cost of capital in the economy. When money is plentiful, base rates are low. When money is scarce, those base rates increase. Either way, the demanded rate equals the so-called “risk-free rate” plus a premium that adjusts the final required rate of return to reflect the perceived risk and volatility of the investment.
It’s not unusual for a business to require capital investment at different times to support various initiatives. Manufacturing, process, mining, and other heavy industries are no exception. For the EVA calculation, we must determine the Weighted Average Cost of Capital (WACC). This is relatively simple.
Suppose a company sought $1,000,000 of angel investment for an entrepreneurial activity and the investors demanded a 10% return on that investment. They’re expecting returns of $100,000 per year. However, suppose the company is successful and wants to grow, so they seek another $1,000,000 of investment. Because of previous success, suppose that the investors demand a 6% rate of return, or $60,000 per year. The combined calculation for our example is as follows:

Therefore, assuming the WACC of 8% and a $2,000,000 total investment, the investors expect $160,000 in annual returns in after-tax income, i.e., Net Operating Profit after Taxes (NOPAT), because this represents the funds that can be distributed.
Now, suppose the company that received the $2,000,000 in investment capital produces a NOPAT of $120,000 for a given year. That represents an accounting profit of 6%, but fails to achieve the WACC requirement of 8%, or a NOPAT of $160,000. So, despite the operation’s ssuccess in creating an accounting profit, it has failed to produce an economic profit. Conversely, suppose the firm produces a NOPAT accounting profit of $200,000 for a given year. In this case, the company has met its WACC obligation of $160,000 and delivered an economic profit of $40,000.
Note that EVA performance drives two major factors that are near and dear to senior managers. These include:
-
- executive bonuses
- access to growth capital
- employee profit-sharing programs.
It’s not uncommon for executive-bonus schemes to be driven by EVA. If the enterprise delivers an economic profit, everyone is happy, and the executives qualify for their bonuses. When the company fails to deliver an economic profit, it is often said to be “underwater,” and executive bonuses suffer. Keep in mind that investors like to bet on winners. Past performance in delivering economic profits both increases the ease with which the organization can access growth capital and greatly reduces the cost of capital rate that will be demanded. A company that’s underwater on its delivery of an economic profit is hard-pressed to obtain additional growth capital and often accept more exorbitant, even usurious, rates on that capital.
Enlightened organizations use a balanced scorecard in determining employee bonuses. EVA performance should be a part of that scorecard, but proportional to an individual’s ability to influence EVA. For example, a plant manager can significantly influence the profitability of his or her plant but will have some limits in the ability to impact the EVA of an entire division or corporation. A plant operator or maintainer has even less direct influence. Still, it is always wise to involve everyone in an organization in the pursuit of EVA and motivate all personnel (management and otherwise) to utilize their creativity and put forth the effort. What gets rewarded tends to get done. Including EVA into a profit-sharing program for all stakeholders is a great way to tap into employee creativity and passion.
CONNECTING OEE AND EVA
I’ve spent a great deal of time and effort on Overall Equipment Effectiveness (OEE) in The RAM Review. My 12-article series on the topic detailed various equipment-, production-, and market/marketing-induced losses to OEE. I’ve brought this concept together in Fig. 1.
As Fig. 1 shows, the cross-functional business model that includes: 1) marketing and sales; 2) product design; 3) process design; 4) equipment design and commissioning; 5) production; 6) maintenance; 7) supply chain; 8) human resources; and 9) finance; must come together to break down silos and create an effective business.The effectiveness of the business is measured as OEE, which is the product of Availability, Yield/Speed, and Quality. OEE represents our total production relative to perfection for the entire business or for a given area and/or timeframe.
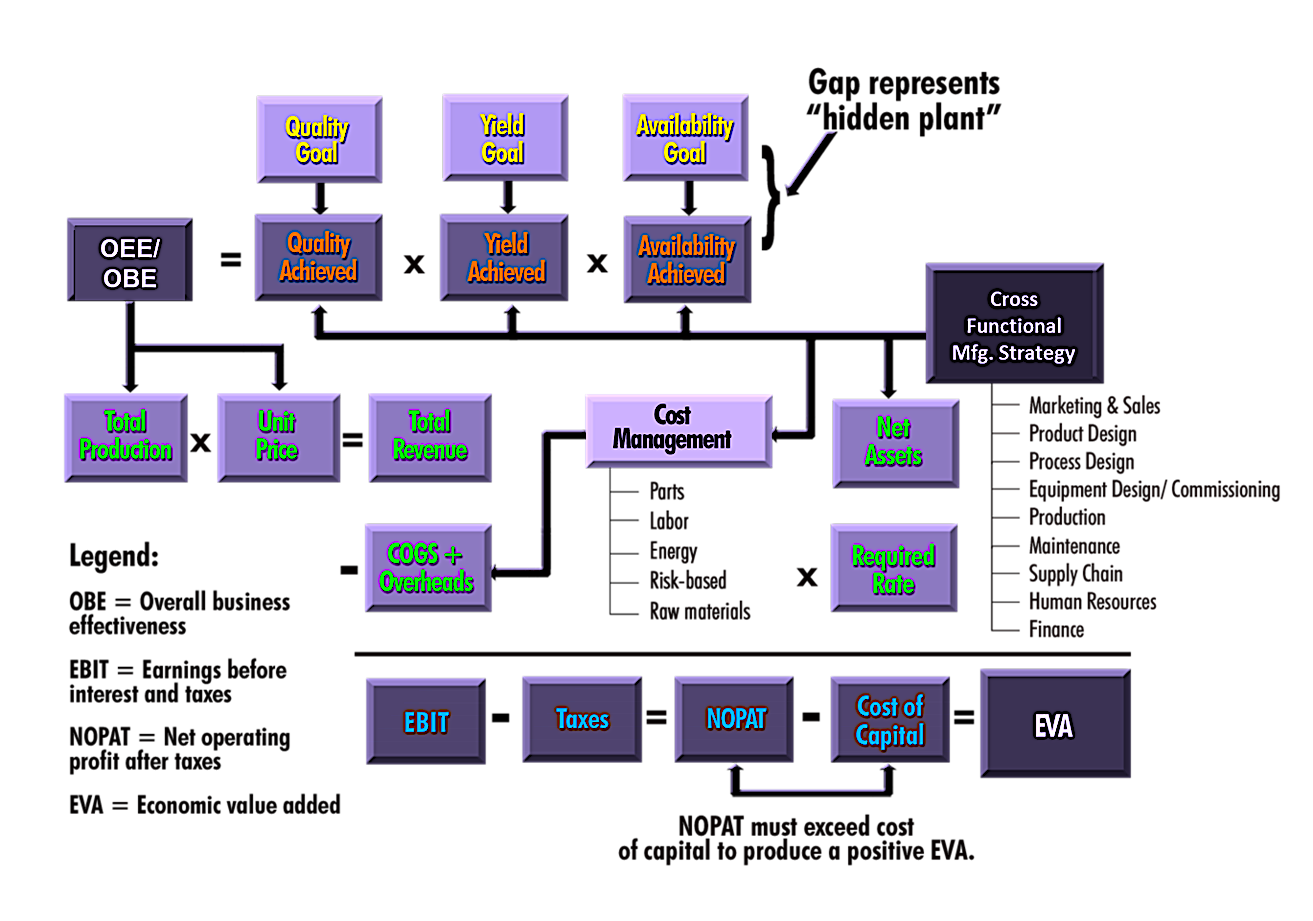 Fig. 1. Connecting the firm’s cross-functional effectiveness, OEE, EBIT, NOPAT, and, ultimately, EVA.
Those nine cross-functional business drivers, combined with market conditions, determine the price the organization fetches for each unit of production. Manufacturing a product that is in demand, effectively marketing that product, and manufacturing the most profitable mix of products will determine the weighted average unit price (WAUP) for production. Total revenue is the product of the total units produced and sold, and the price of those units sold.
The same cross-functional factors significantly influence a firm’s cost of operations for: 1) raw materials; 2) energy; 3) labor; 4) maintenance parts; and 5) risk-based costs. This translates into Cost of Goods Sold (COGS). COGS plus overheads, or fixed costs, per unit of production determines the overall cost of production. It’s important to note that OEE has an enormous affect on the fixed cost burden per unit of production. The marginal profitability is greater for a company’s next unit of production than for its last.
Furthermore, the cross-functional business strategy affects NOAP. If the operation is reliable, it can be lean in terms of redundant systems, critical spares, maintenance-, repair-, and operations- (MRO) inventory and production inventory. An unreliable operation must mitigate risk with redundancy, spares, and/or inventory. Because the cost of capital equals NOAP times the WACC, the hurdle to produce an economic profit from operations is lower for the lean operator.
Subtracting COGS and overheads from total revenue results in the EBIT/EBITDA. Taxes must then be subtracted from the EBIT/EBITDA to determine NOPAT. Organizations go to great lengths to minimize their tax bills because doing so can affect their NOPAT significantly, as compared to EBIT/EBITDA. Of course, the cost of capital must be subtracted from the NOPAT to determine EVA and if the company is above water or underwater in its quest to produce economic profit.
CONCLUSIONS
In this article, we’ve tackled Economic Value Added (EVA), which determines an organizations economic profit once the Weighted Average Cost of Capital (WACC) is subtracted from the firm’s accounting profit. EVA is critical management-effectiveness KPI that affects an organization’s access to capital, not to mention the cost of that capital. Moreover, in many instances, EVA also has a bearing on executive bonus schemes and employee profit-sharing programs (which is advisable given the fact that what gets rewarded gets done).
RAM professionals affect the performance of assets, which drives Overall Equipment Effectiveness (OEE) and operating costs. Moreover, a reliable operation is leaner in the of the Net Operating Asset in Place (NOAP) because it requires fewer redundancies and less inventory, all of which bloat the NOAP. For equipment-intensive operations, i.e.,manufacturing, process, mining, and other heavy industries, effective equipment-asset management often determines if the firm is above water or underwater in its pursuit of economic profitability. So it’s important for all of us in the RAM arena to step up and do our part to drive EVA.
In next week’s edition of The RAM Review, we’ll turn our attention to the asset-management aspects of a balance sheet that are important to members of the RAM community.TRR
REFERENCE
Troyer, Drew (2000-2020). Plant Reliability in Dollars & $ense Coursebook. (Editor’s Note: This coursebook accompanies the author’s four-day workshop on the subject.)
ABOUT THE AUTHOR
Drew Troyer has over 30 years of experience in the RAM arena. Currently a Principal with T.A. Cook Consultants, he was a Co-founder and former CEO of Noria Corporation. A trusted advisor to a global blue chip client base, this industry veteran has authored or co-authored more than 300 books, chapters, course books, articles, and technical papers and is popular keynote and technical speaker at conferences around the world. Drew is a Certified Reliability Engineer (CRE), Certified Maintenance & Reliability Professional (CMRP), holds B.S. and M.B.A. degrees. Drew, who also earned a Master’s degree in Environmental Sustainability from Harvard University, is very passionate about sustainable manufacturing. Contact him at 512-800-6031, or email dtroyer@theramreview.com.
Tags: reliability, availability, maintenance, RAM, key performance Indicators, KPIs, Economic Value Added, EVA, Return on Net Assets, RONA, Overall Equipment Effectiveness, OEE

