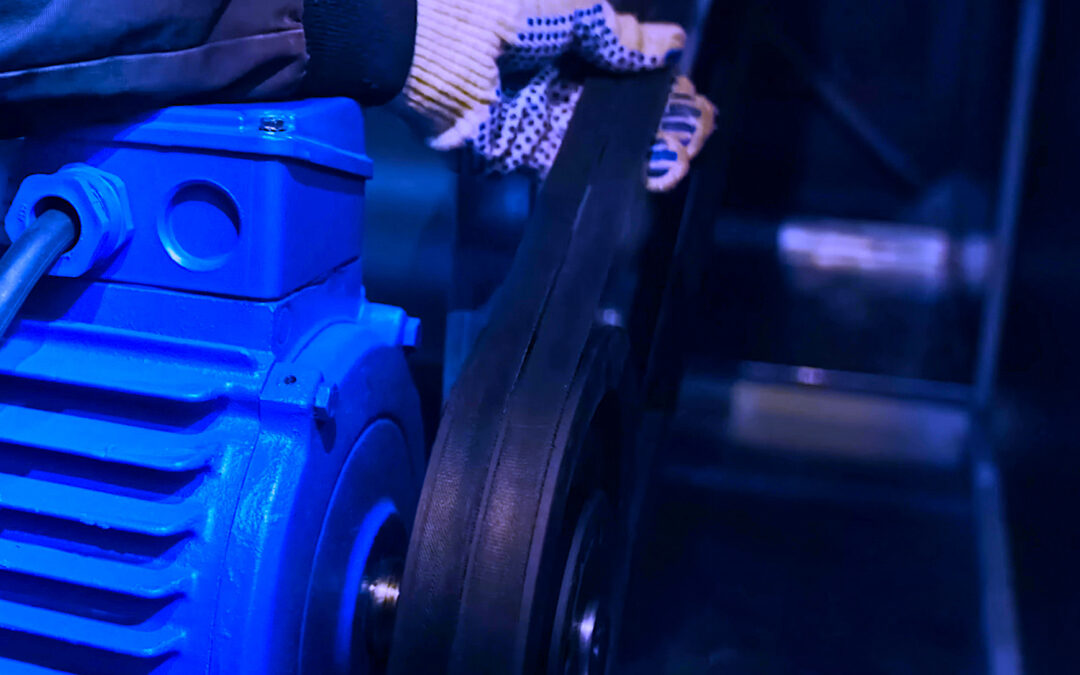
Fans, pumps, and compressors represent 60% of motor-driven equipment. A majority of the fans and a small number of pumps and compressors are belt-driven applications. While seemingly simple, belt applications are notoriously complex, involving belt tensioning, alignment, and sheave condition. In this Electrical Signature Analysis ( ESA) case study, we review a 75-hp, 1780-rpm, 460 Vac electric motor, with a larger sheave on the motor and smaller sheave on the fan. The findings also point to the overall energy and environmental impact of the defects.
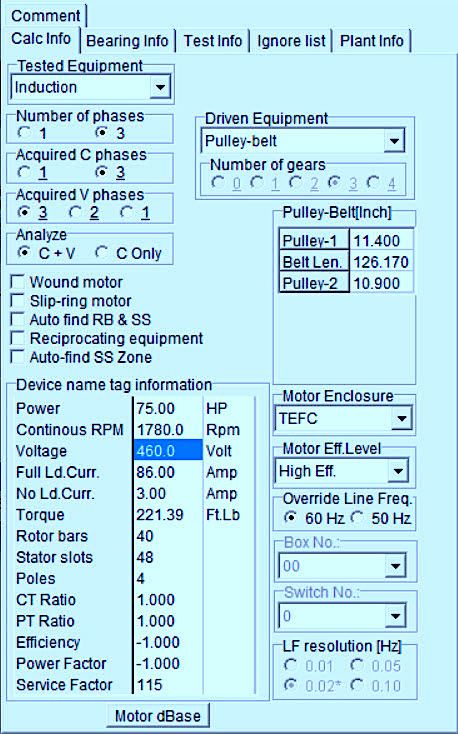
Fig. 1. Motor nameplate and belt and sheave data.
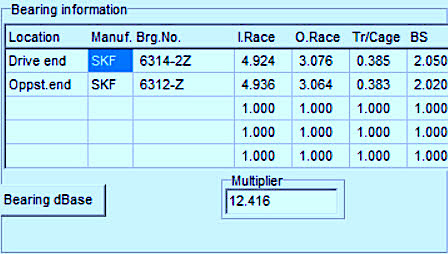
Fig. 2. Bearing information.
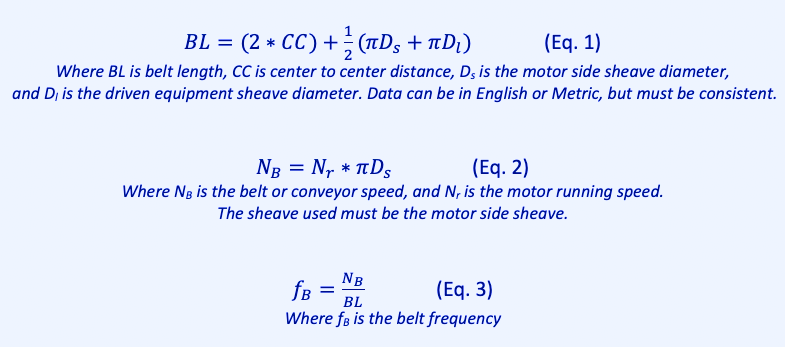
Figures 1 and 2 show the primary data for analysis of a motor and belted application. In the case of Fig. 1, the belt length is already known, and includes the size and “stretch.” When belt information is unknown, the length can be determined, as shown in Equation 1. (Equation 2 denotes the speed of the belt, and Equation 3 is the belt frequency that we will see in the spectra, should there be issues with the belt.)
As noted, the operating conditions of the motor are required. That information is shown in Fig. 3.
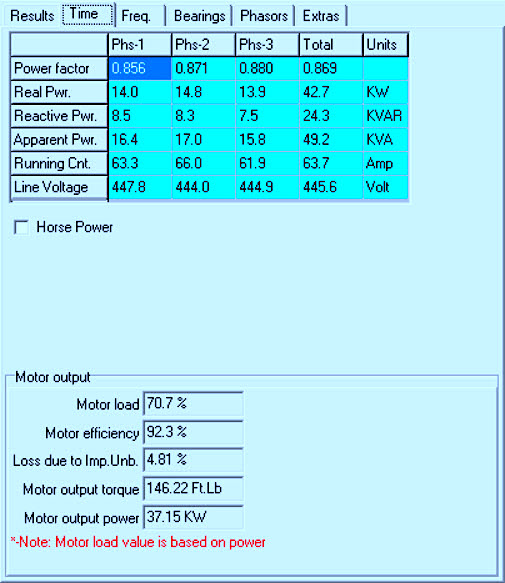
Fig. 3. Operating conditions for the motor.
The operating speed (tab Freq.) is 29.802 Hz (1788.12 rpm).
In this case, the frequencies that we are interested in include the belt frequency, driven running speed, bearing frequencies, and static eccentricity signatures. Once these are determined, the condition of the belts, sheaves, and alignment are known. Regarding the example above, the driven-equipment frequency would be calculated as shown in Equation 4.
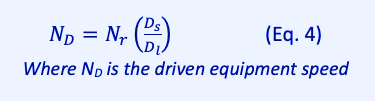
The frequencies we are looking for will be ND = 31.169 Hz, fB = 8.459 Hz, and static eccentricity (1012.08 Hz, 1132.08 Hz, 1252.08 Hz, 1372.08 Hz). Bearing frequencies can be calculated from the running speed times the multipliers in Fig. 2.
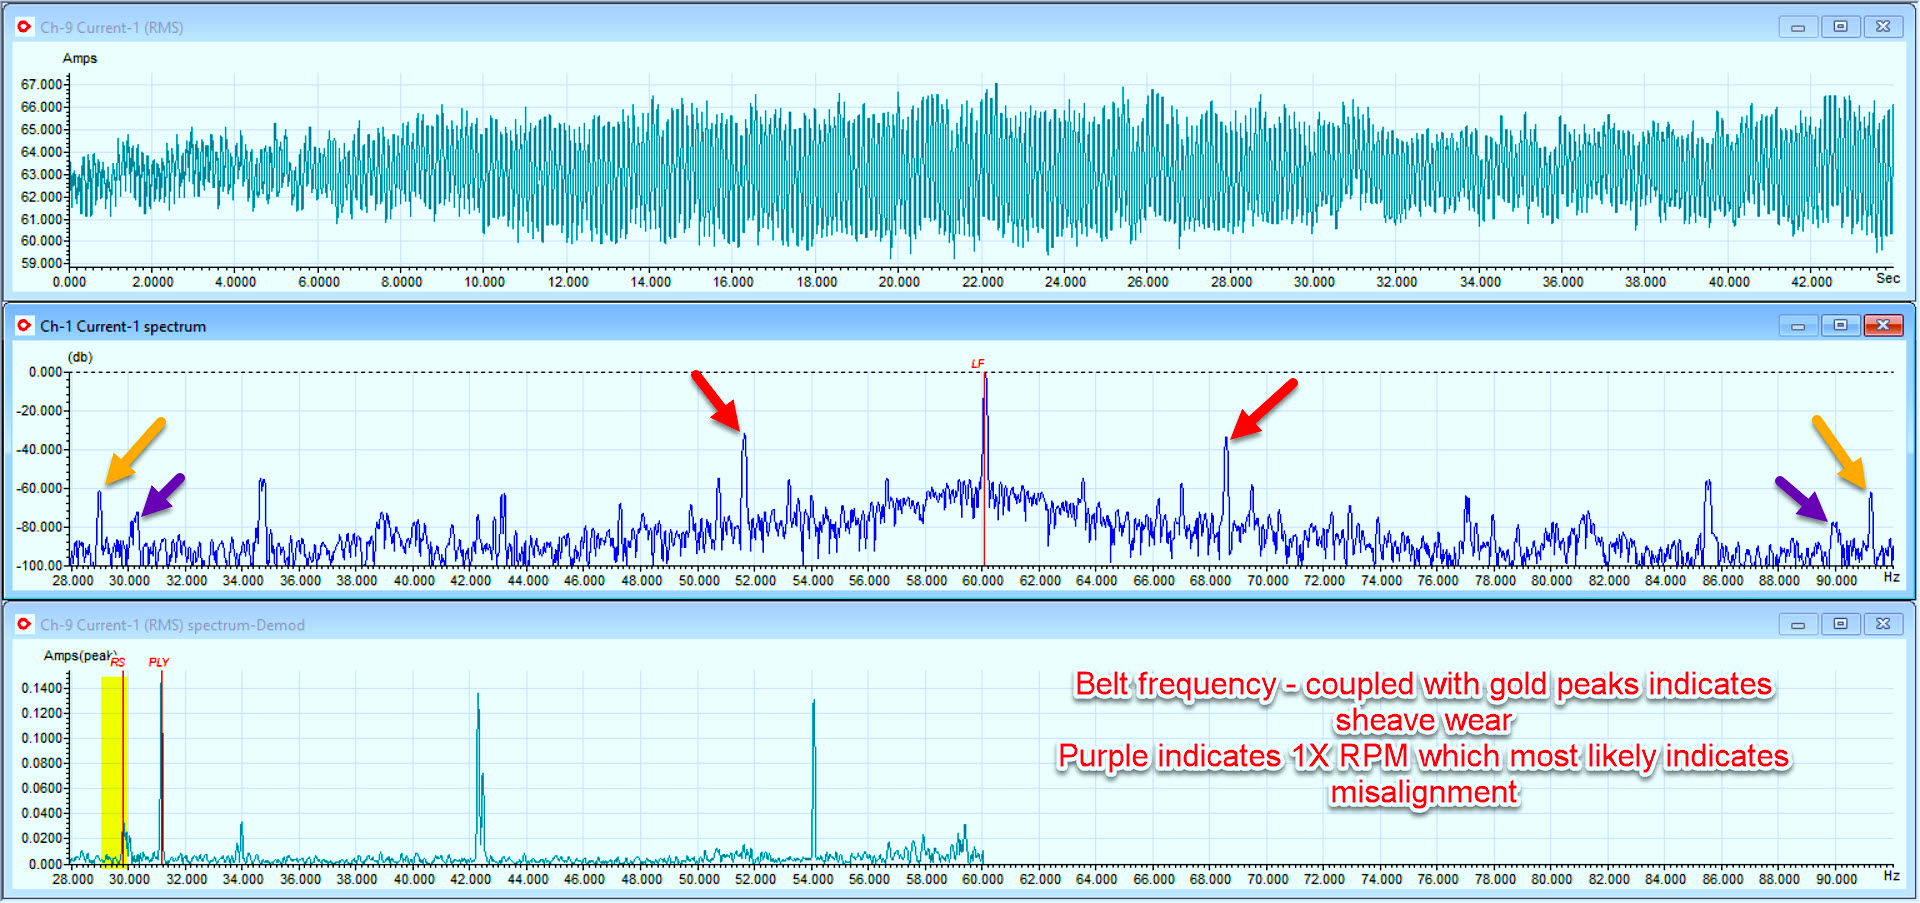
Fig. 4. Low-frequency data showing very high belt frequency and
small running and driven-equipment peaks.
As shown in Fig. 4, the belt frequency peaks are high-coupled with lower-level 1X running speed and driven equipment speed peaks. This would indicate misalignment, and belt and sheave wear. However, it does not indicate whether the belts are too tight or too loose.
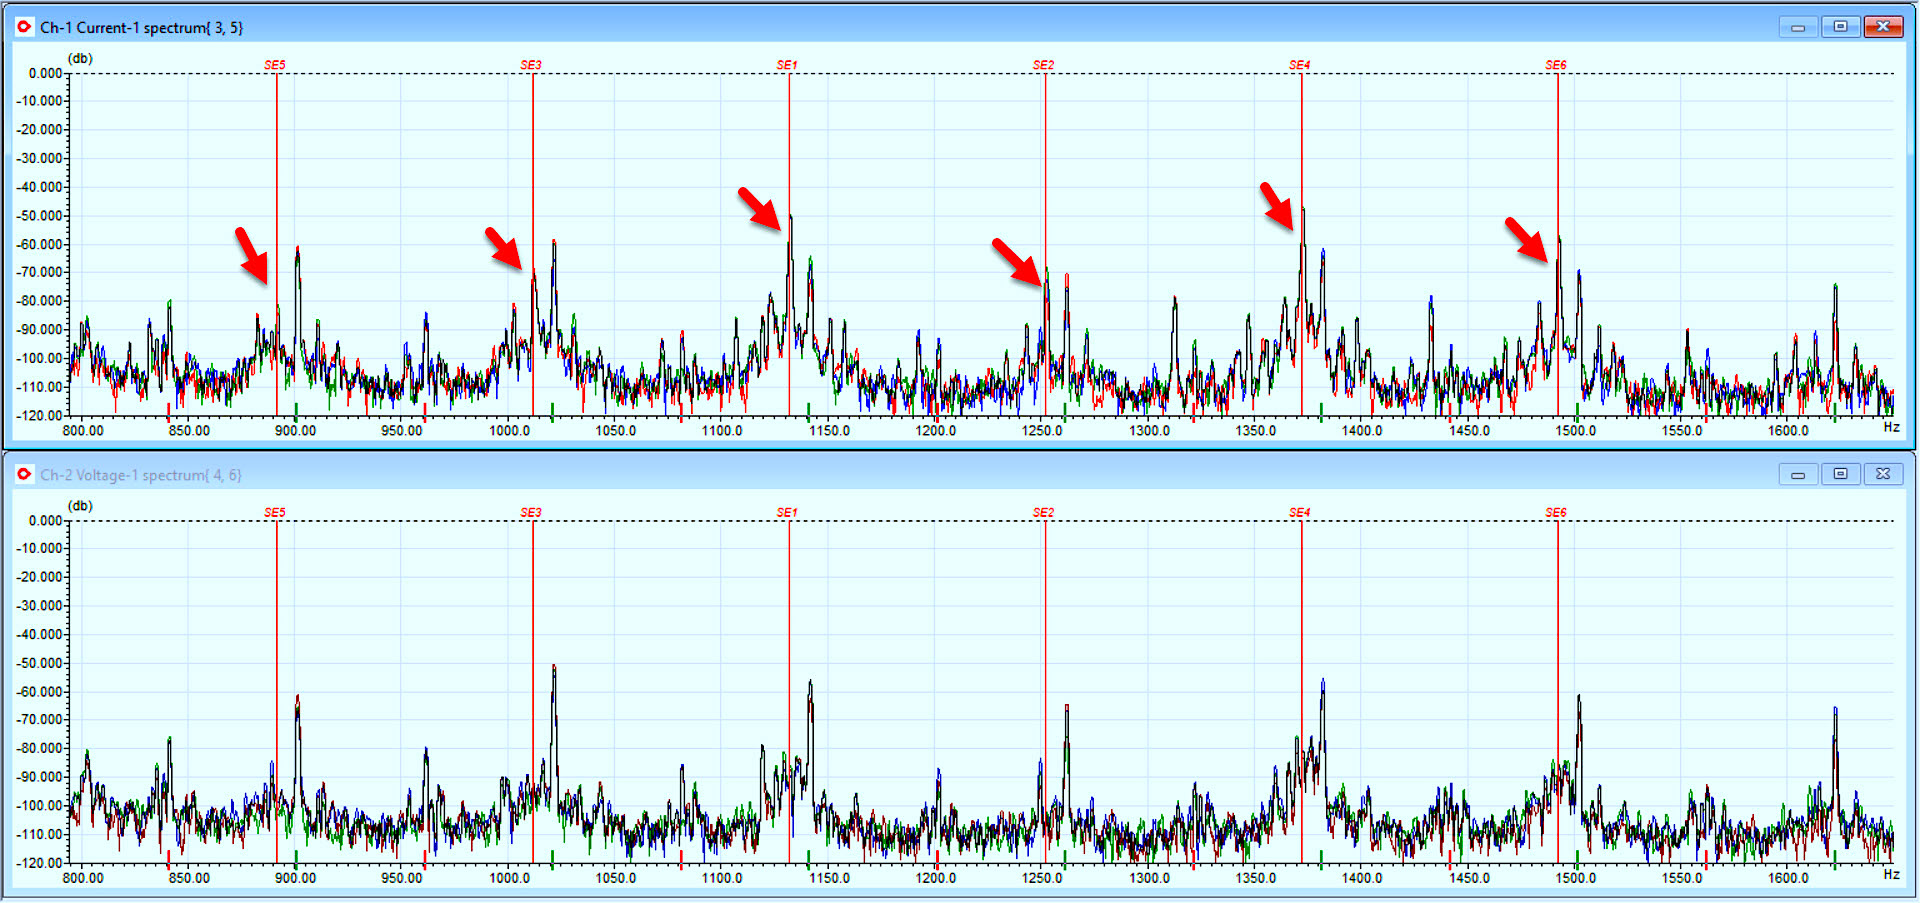
Fig. 5. High-frequency static eccentricity.
Figure 5 shows the static eccentricity, but also with the unusual signature of sidebands of the belt frequency. This indicates that the belts are both too tight, pulling the shaft and causing the rotor to bow in the opposite direction of the driven equipment, using the bearings as hinge points. In the case of this application, small bearing peaks are also present. Overall, it appears that the sheaves and belts are worn, belts over-tensioned, and the sheaves are misaligned.
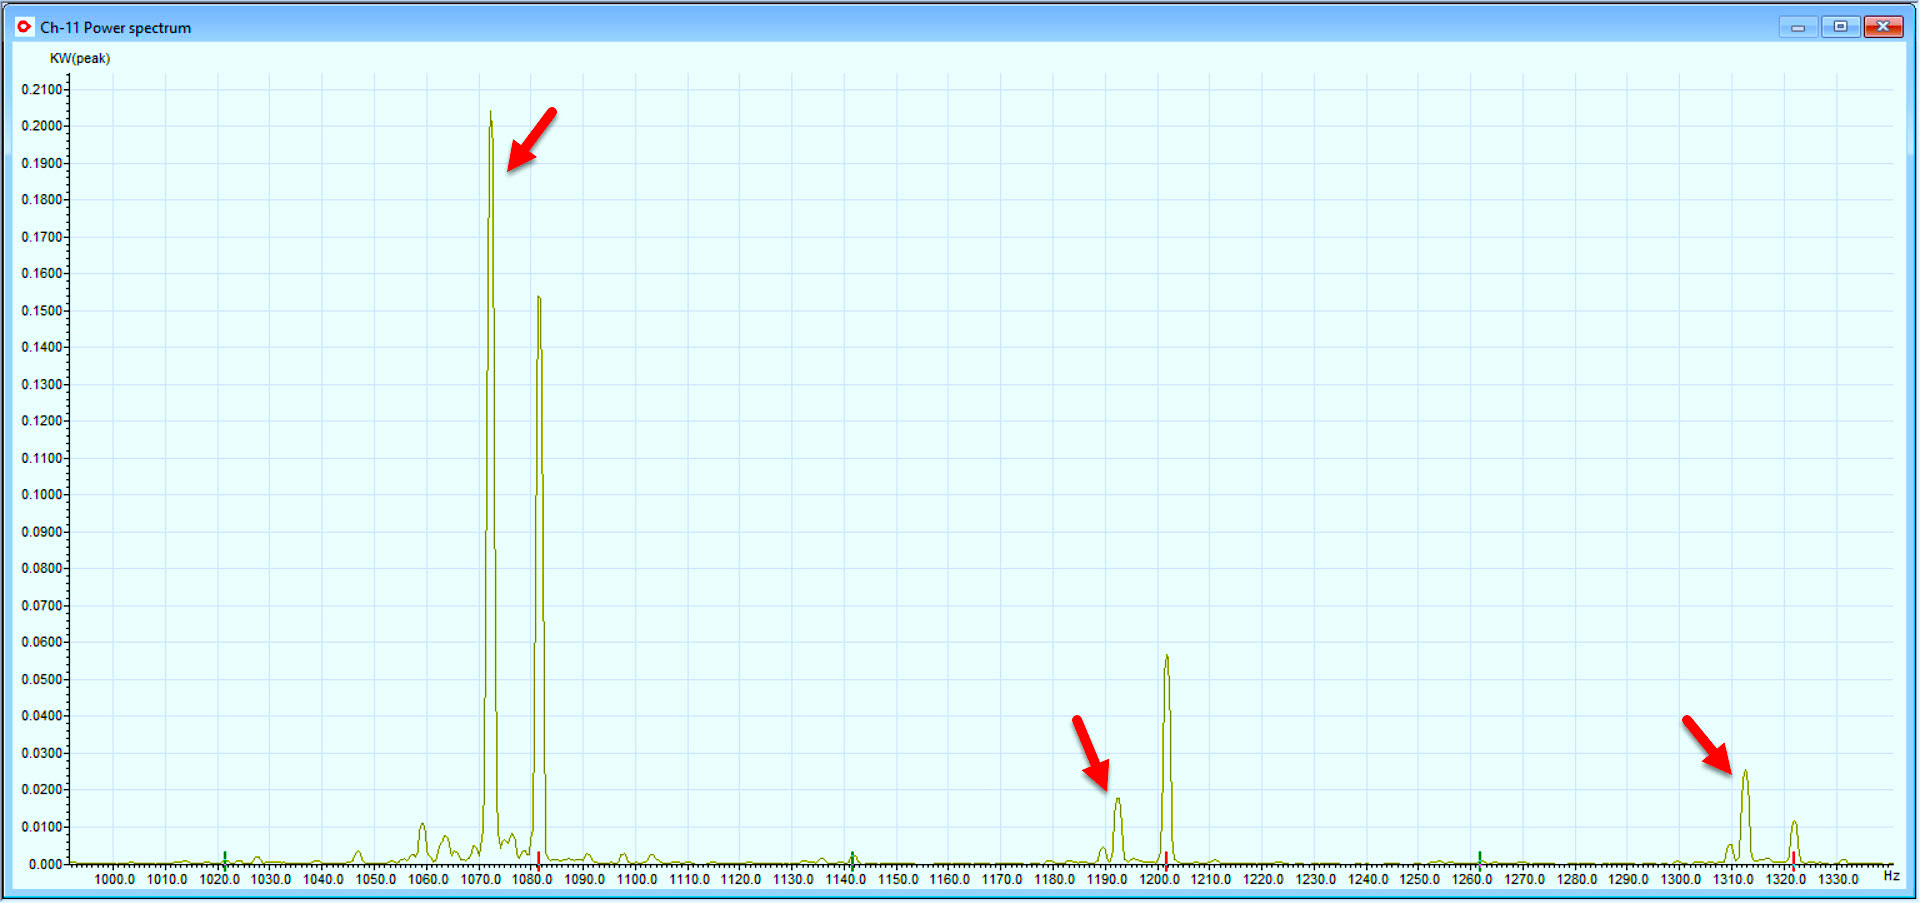
Fig. 6. Static eccentricity peaks in kilowatts (total 0.28 kW).
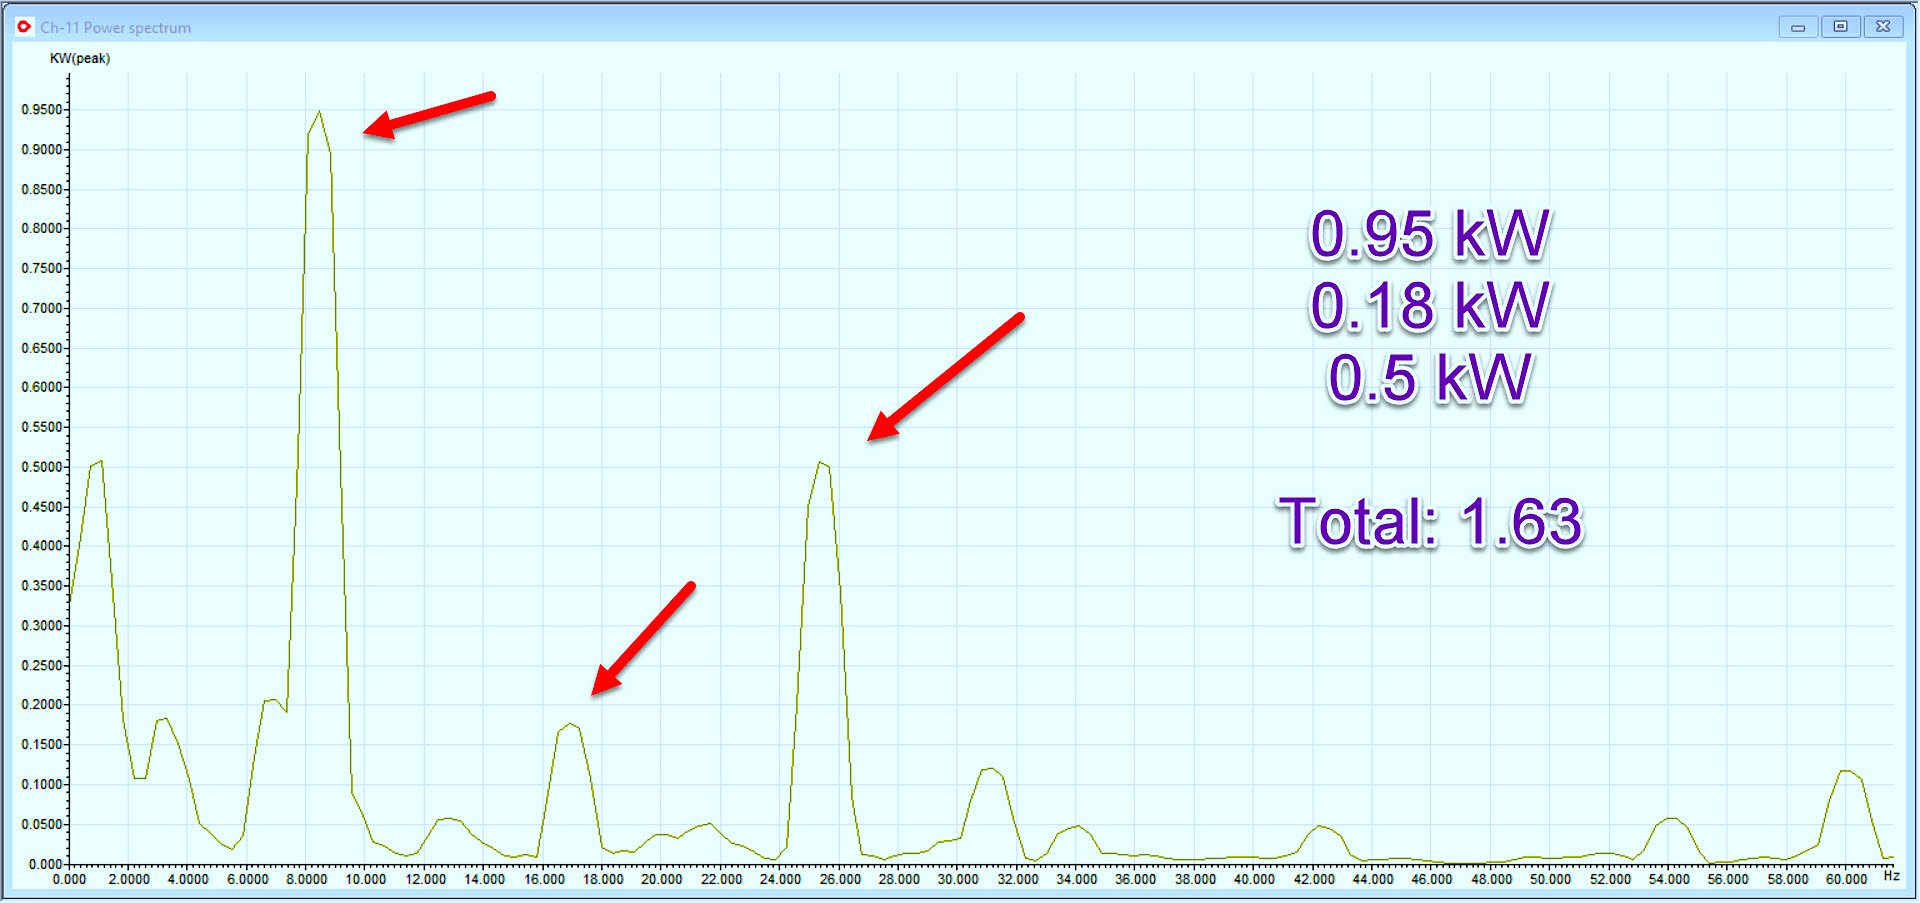
Fig. 7. Belt frequency with second and third harmonics (total 1.63 kW).
The total losses associated with the belt-related defects shown in Figs. 6 and 7 is 1.91 kW. This would represent 5% of the total motor load (Figure 3). Assuming the machine operates 6000 hours per year, and assuming the belts or bearings don’t catastrophically fail, with a cost of $10/kW demand and $0.10/kWh usage, the costs associated with the defects would be ~$230 demand and ~$1146 usage. The usage would be 11,460 kWh (11.46 MWh) with a U.S. average 0.909 Tons CO2/MWh, which would translate to 10.4 Tons defect-related CO2.
THE TAKEAWAYS
Overall, proper management of belted applications has a significant impact on the reliability of the equipment. It also has an impact on the energy consumption and greenhouse gas emissions of a facility.
Keep in mind that individual defects add up. As this case study showed, the belt, sheave, and dynamic eccentricity losses due to improper belt alignment and tensioning appear to have caused at least 5% extra loading on the motor. And, as the defects progress, the losses will continue to increase until the belts, sheaves and/or bearings fail.
The application of Electrical Signature Analysis not only detects the development of defects, but can also identify the bottom-line impact of those defects. This can help determine the best time to perform corrective maintenance outside of catastrophic failure.TRR
Click On The Following Links To Read The Previous Articles In This Series
“(Part I): Static and Dynamic Eccentricity” (Nov. 8, 2020)
“(Part II): Alignment Case Study” (Nov. 13, 2020)
ABOUT THE AUTHOR
Howard Penrose, Ph.D., CMRP, is Founder and President of Motor Doc LLC, Lombard, IL and, among other things, a Past Chair of the Society for Reliability and Maintenance Professionals, Atlanta (smrp.org). Email him at howard@motordoc.com, or info@motordoc.com, and/or visit motordoc.com.
Tags: motors, pumps, compressors, belts, belt-driving equipment, motor testing, air gap eccentricities, air gap defects, air gap faults, rotor defects, reliability, availability, maintenance, RAM, electrical signature analysis, ESA, vibration analysis

