In Part I of this series (Nov. 9, 2020, see link at end of this article), we identified the impact of the severity of air-gap changes on the Electrical Signature Analysis (ESA) test results. In the following case study, we will review a pump application on a variable-frequency drive (VFD), which had been subject to an improper alignment practice that caused static eccentricity. We’ll also identify the energy losses associated with the eccentricity.
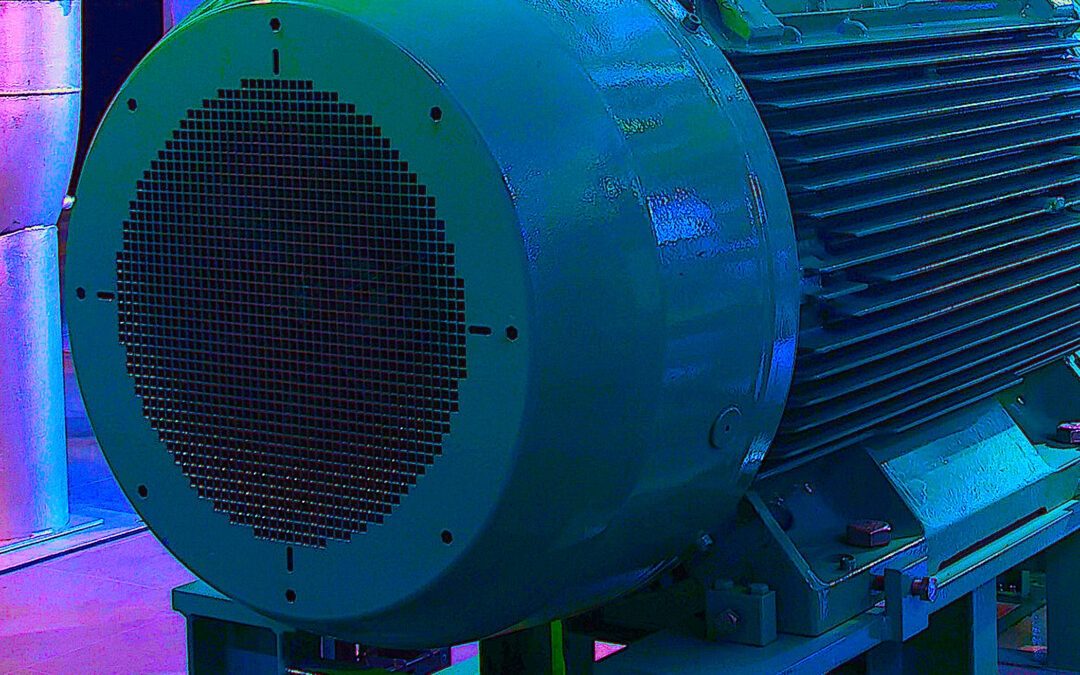
As shown in Fig. 1, the motor that’s being analyzed is a new installation. Its nameplate is shown in Fig. 2.
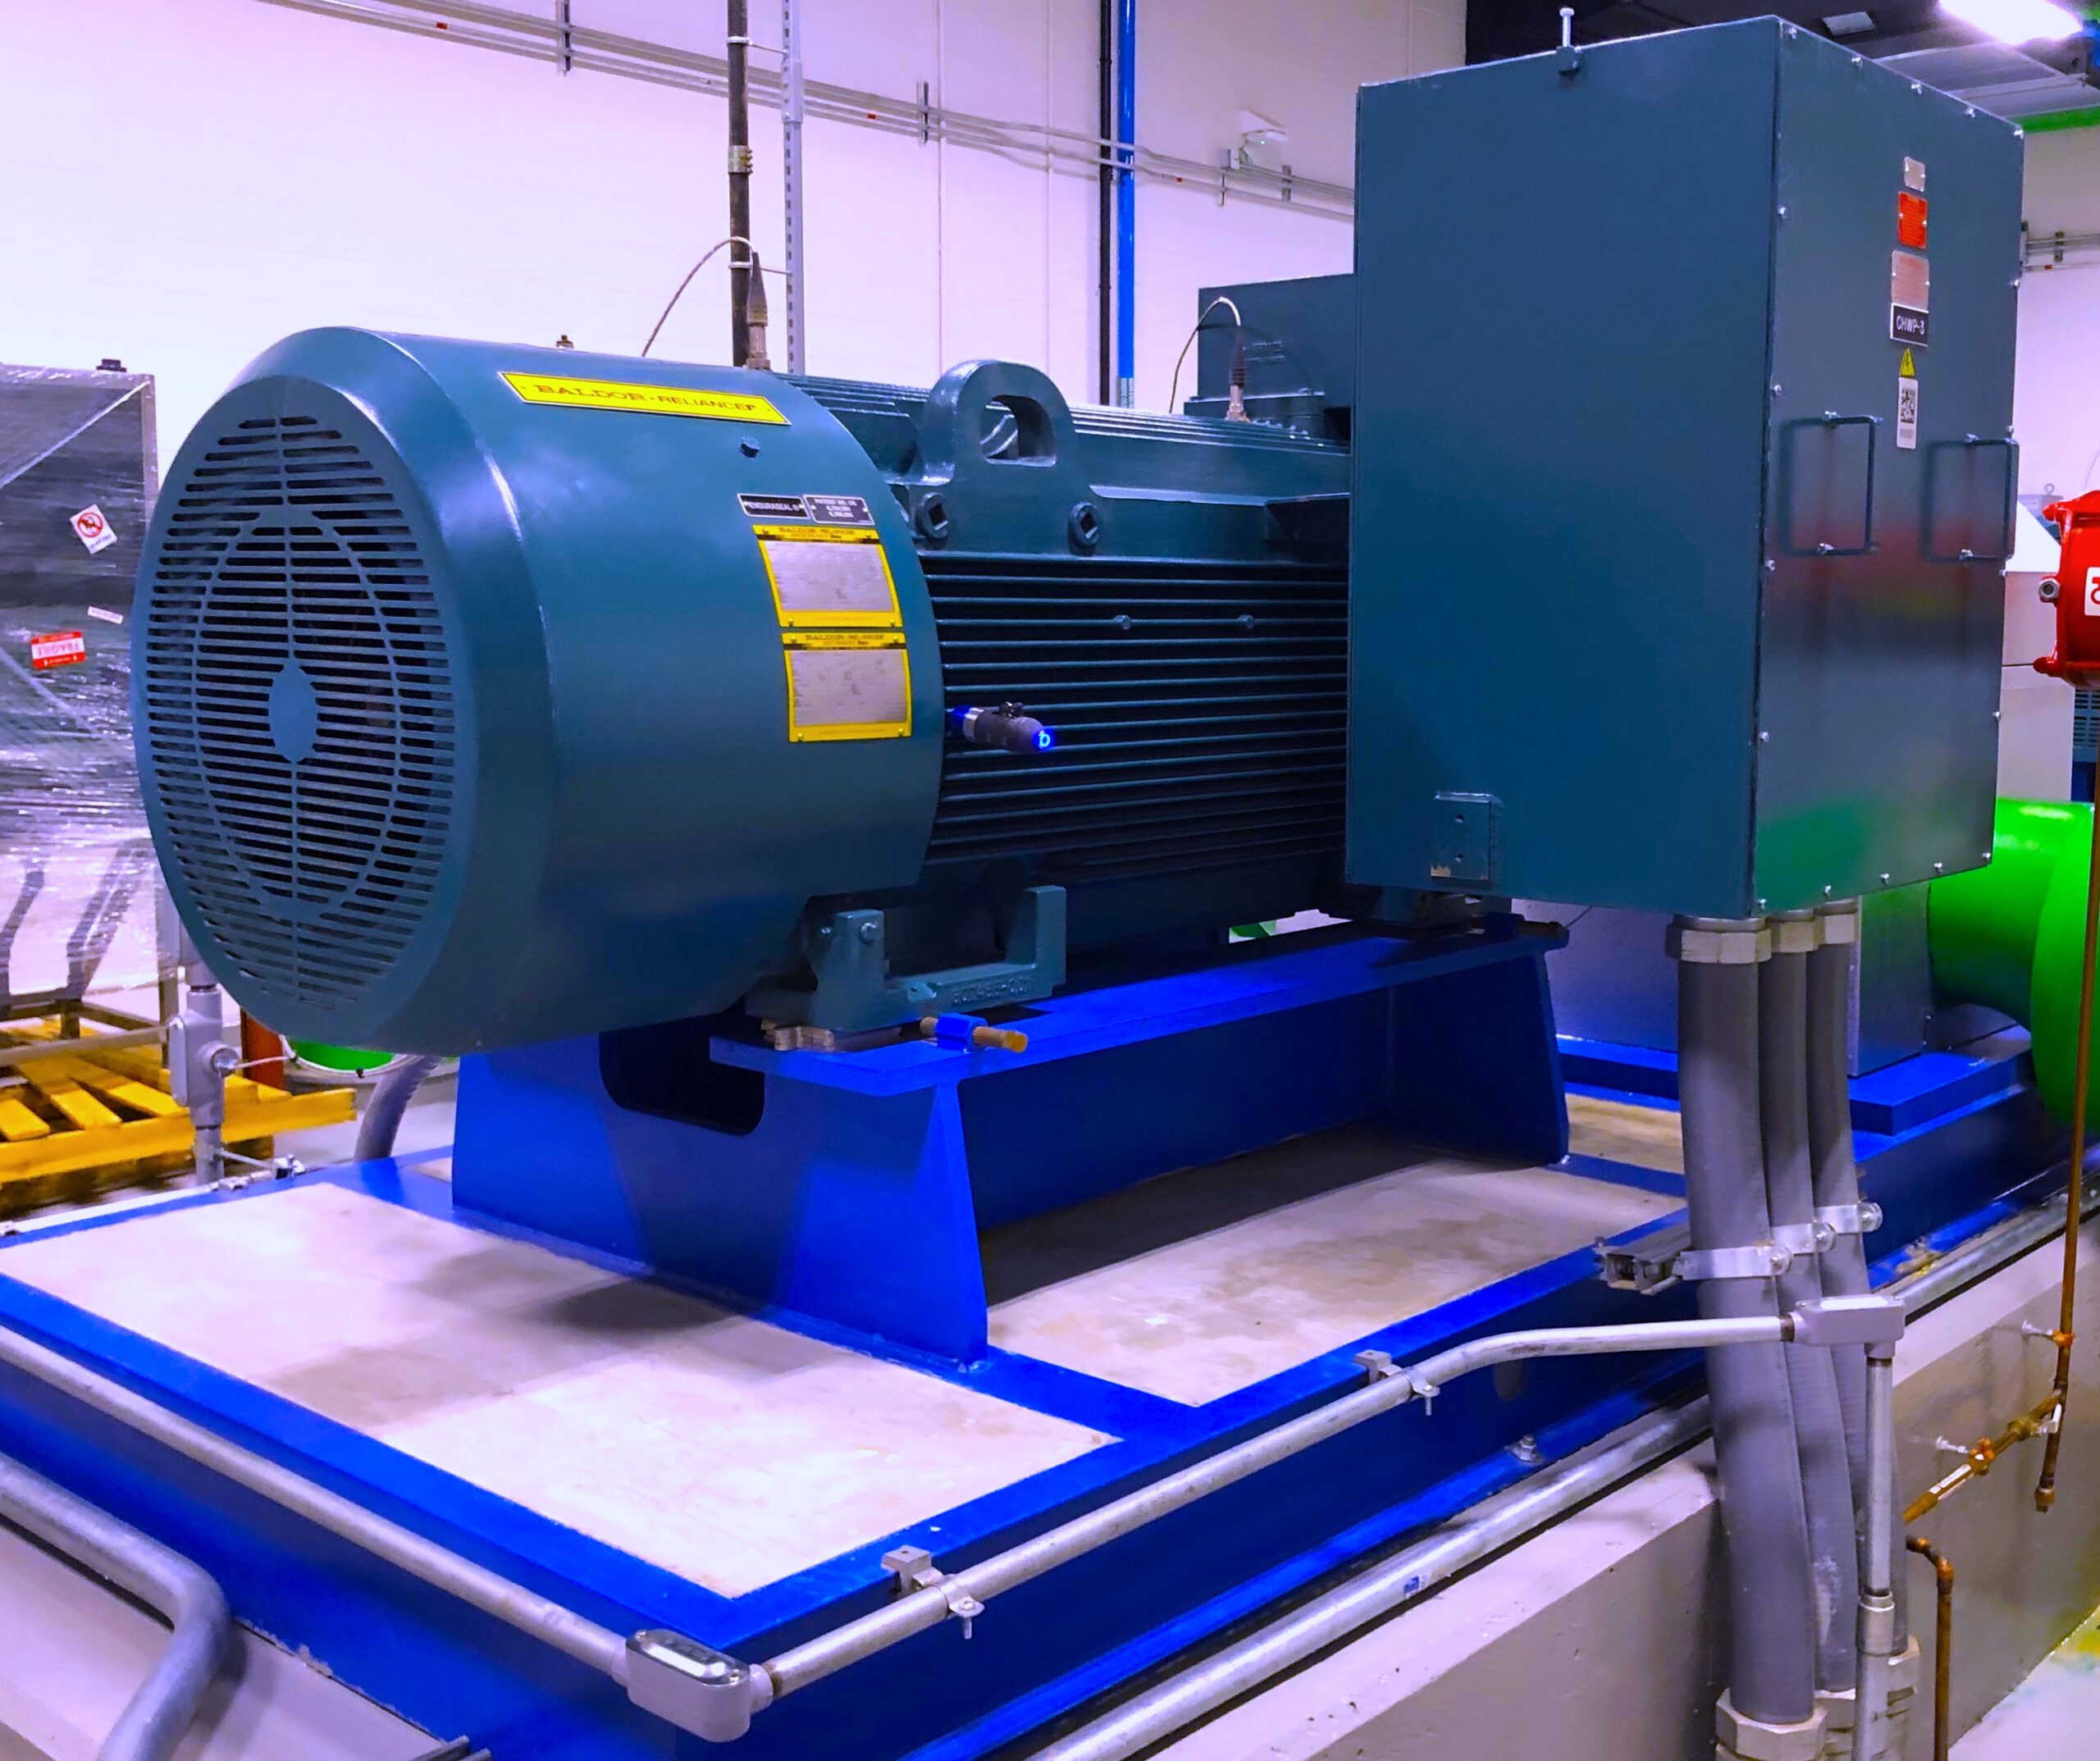
Fig. 1. A newly installed 600-hp, 1789 rpm, 460 V motor and pump on a variable frequency drive.
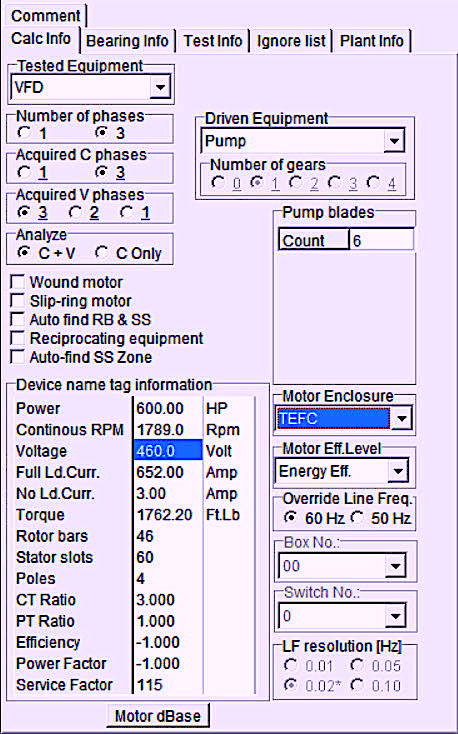
Fig. 2. Nameplate with motor and pump data for analysis.
While a number of issues were present in this application, one area of contention was the alignment and the placement of shims, as shown in Fig. 3. The bolts were torqued down to specification. As noted, a significant number of undersized shims were used on each foot on the outside of the mounting bolts. With a long stator frame, this will cause the center to sag and move the stator and rotor in relation to each other. In effect, the air gap will change, and it was expected that we would see static eccentricity.
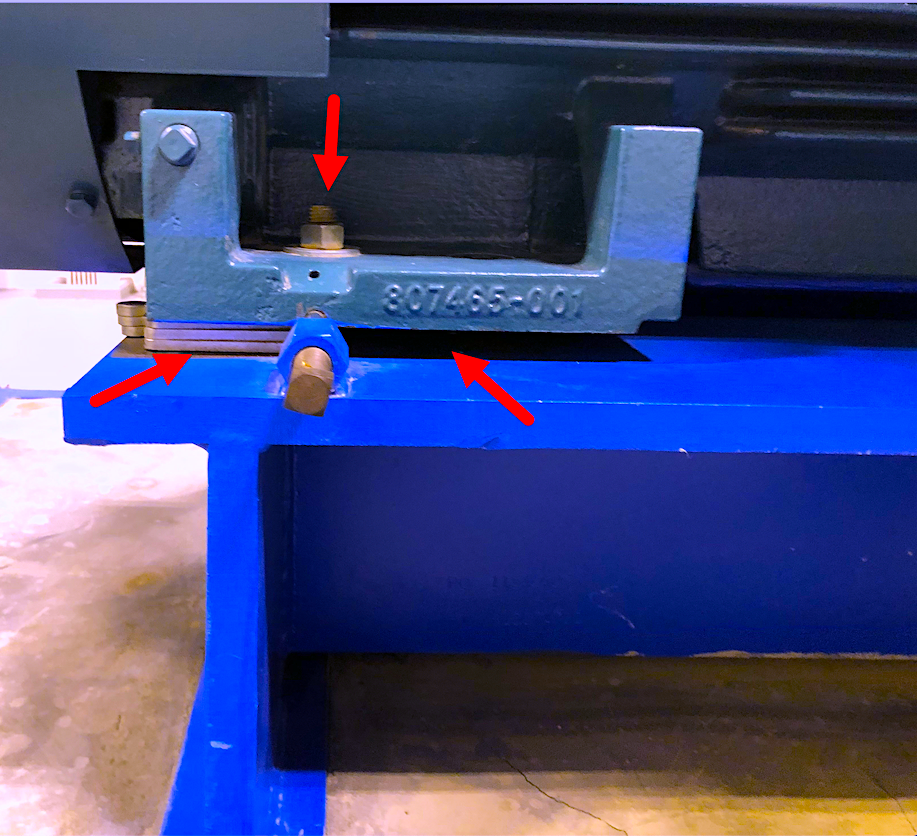
Fig. 3. Shims, mounting bolt, and open area shown under motor foot. This is the arrangement on all four feet.
The VFD was operating at ~41.8 Hz, with a motor running speed of 20.5 Hz (1230 rpm) and 46 rotor bars. The result would be peaks associated with (20.5 Hz * 46 RB) +/- LF, 3LF, 5LF, or peaks at ~734 Hz, ~818 Hz, ~901 Hz, ~985 Hz, ~1068 Hz, ~1152 Hz. Due to drive parameter issues, the running speed was unstable, so the peaks we looked for (Fig. 4) are approximate.
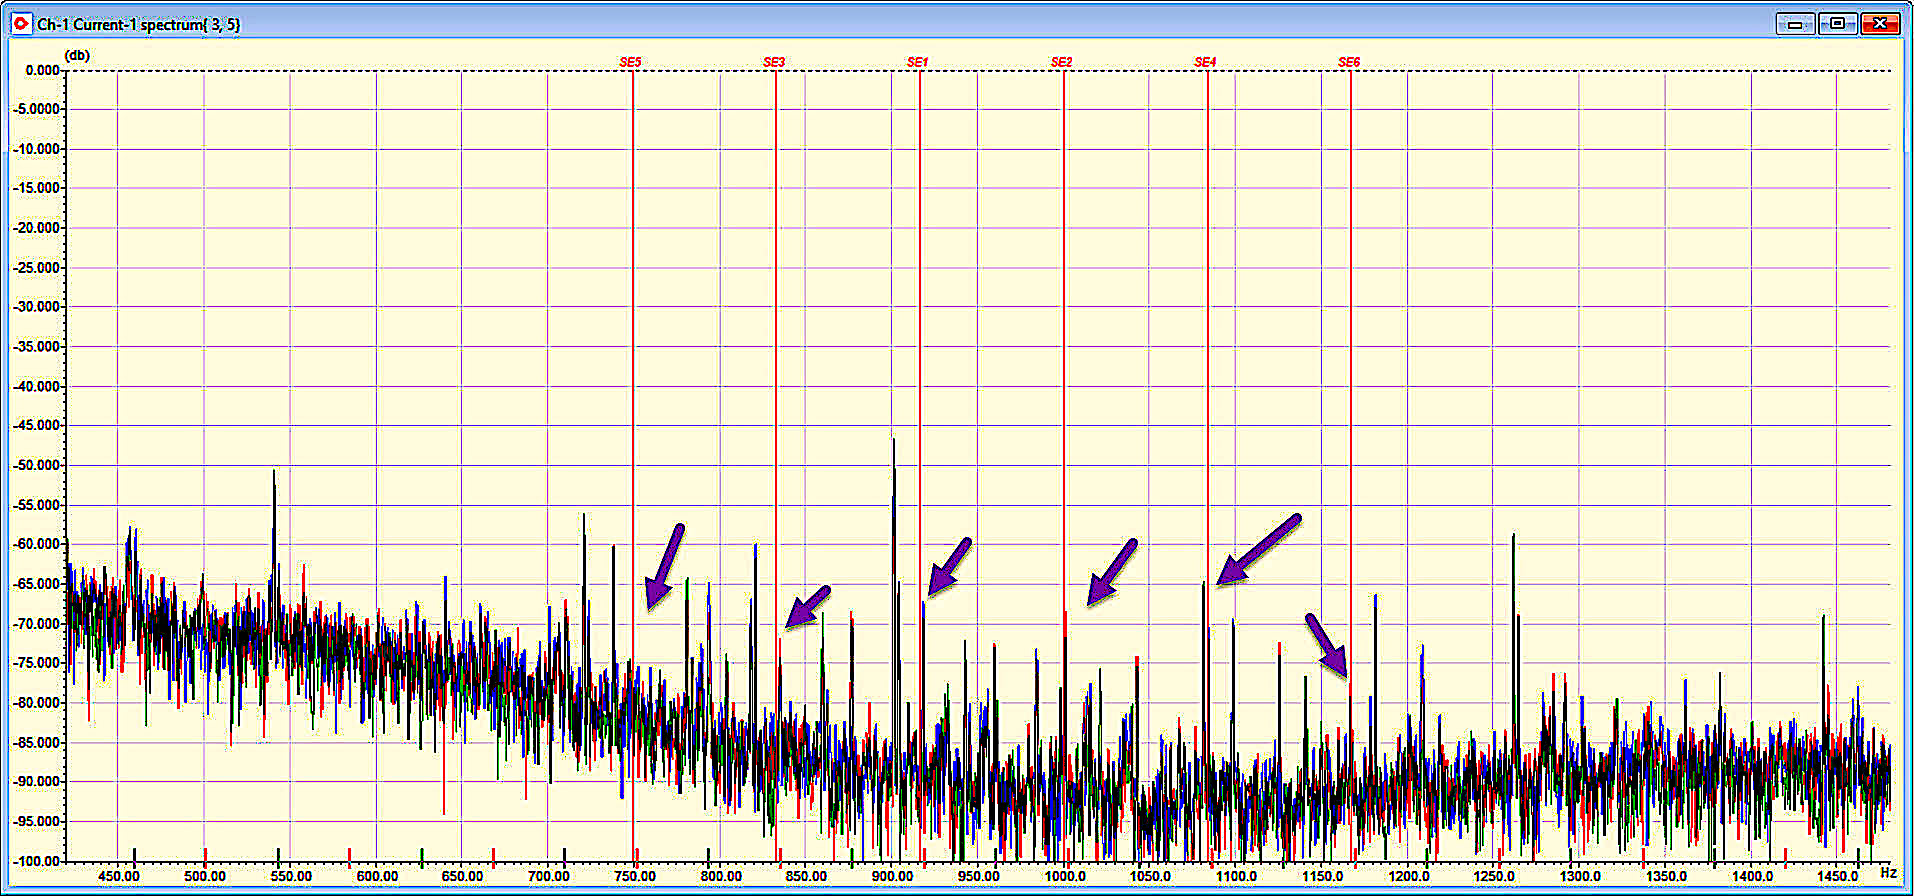
Fig. 4. Static eccentricity with some nearby noise peaks associated with the VFD.
When evaluated in kW spectra, also referred to as power analysis, the carrier frequency is removed from the calculation leaving the dynamic eccentricity as the running speed times the rotor bars. And, similar to vibration, there will be sidebands. With the removal of the carrier frequency, the sidebands will be 1X line frequency versus twice the line frequency found in vibration. We also convert the data back to linear versus log spectrum dB peaks, resulting in actual values of the loss associated with the frequency, as shown in Fig. 5.
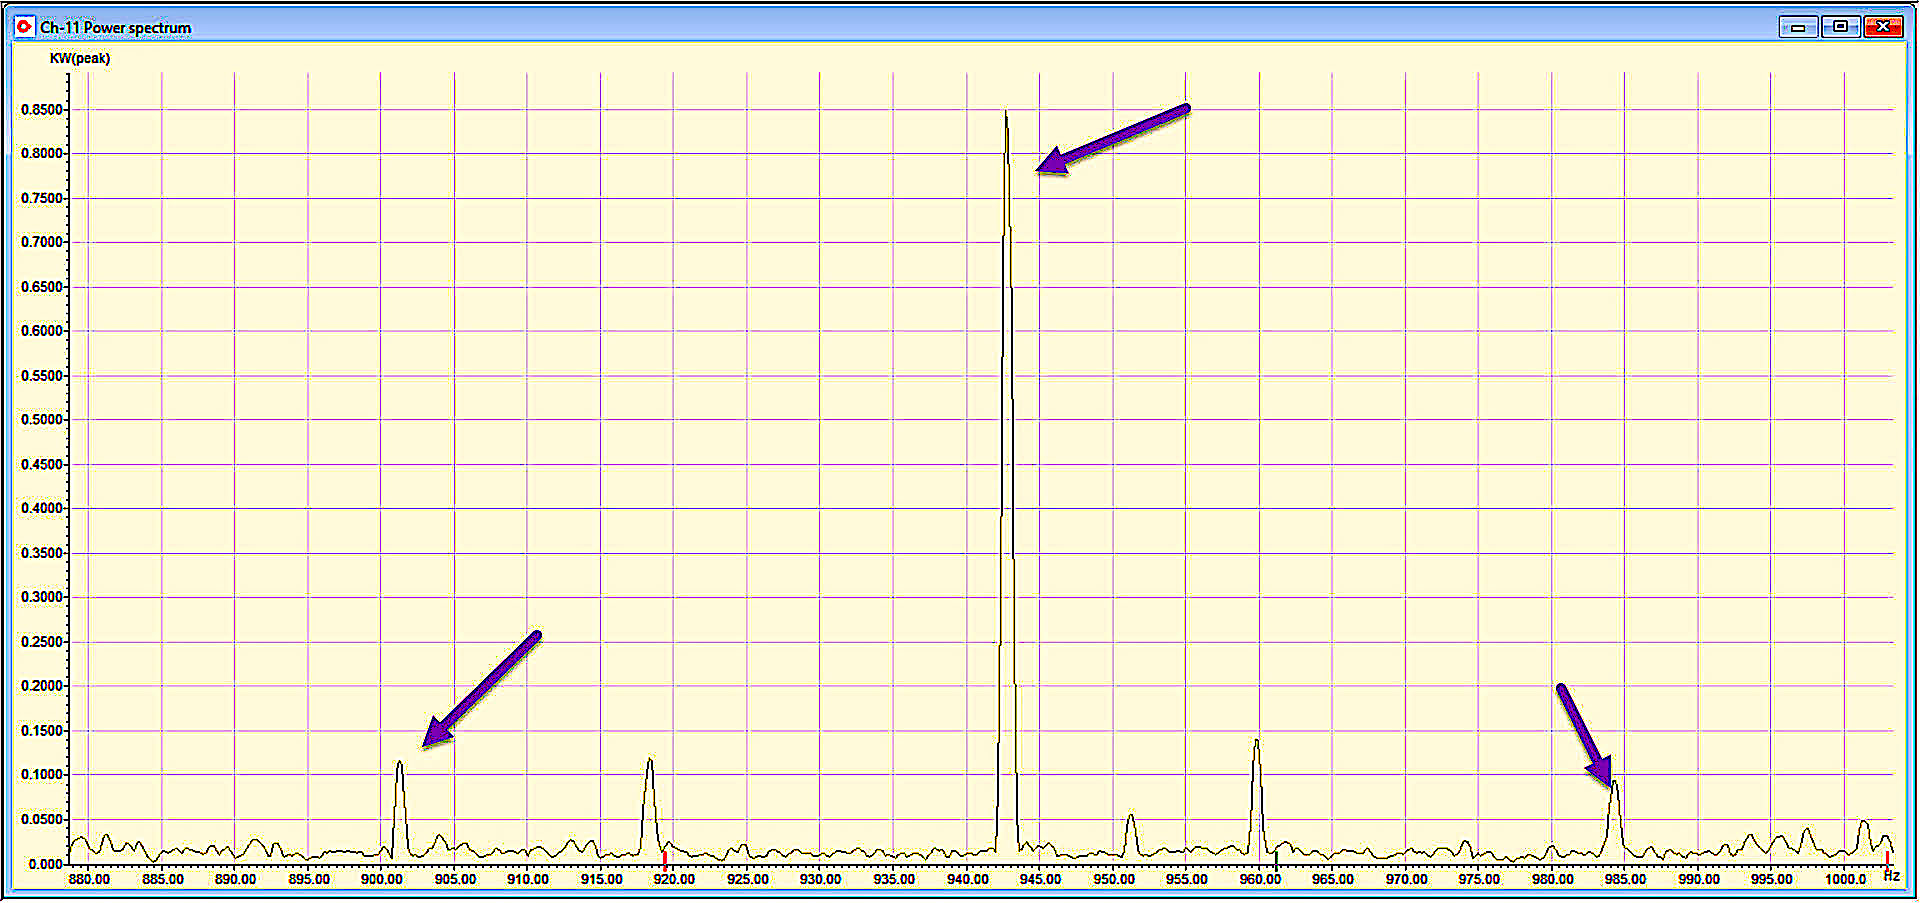
Fig. 5. The kW losses associated with static eccentricity (0.85 kW + 0.1 kW + 0.1 kW = 1.05 kW).
As noted in Fig. 5, the total losses associated with the static eccentricity would be 1.05 kW of the 176 kW that the motor was operating at the time. While this may not appear to be a lot, the UMP (Unbalanced Magnetic Pull) load of 1.05 kW is acting as a load on the bearings, as well as on flexing components of the rotor and winding. Over a long period of time, the overall life of the machine will be reduced, and its resistance to failure in adverse conditions is reduced (Ref. “Evaluating Reliability of Insulation Systems for Electric Machines,” Penrose, 2014 IEEE EIC Conference).
With regard to vibration, the associated peaks would show as in Figs. 6 and 7, presented in acceleration (g). As noted, the values are extremely low in vibration, which is where the disagreement was identified. The question, in this instance, concerns the less-than-perfect alignment with a cost (12 hours operation, 365 days per year = 4380 hours) of 1.05 kW * 4380 hrs = 4,599 kWh. At $10/kW demand and $0.10/kWh, the annual additional cost would be (1.05 kW * 12 months * $10/kW) $126 in demand charges and (4,599 kWh * $0.10/kWh) $460 in usage for $586/yr energy costs. Additionally, for the area, electrical usage is determined at 0.909 Tons CO2/MWh (*4.599 MWh) or 4.2 Tons CO2 emissions per year. That can be balanced against the costs of the properly sized shims.
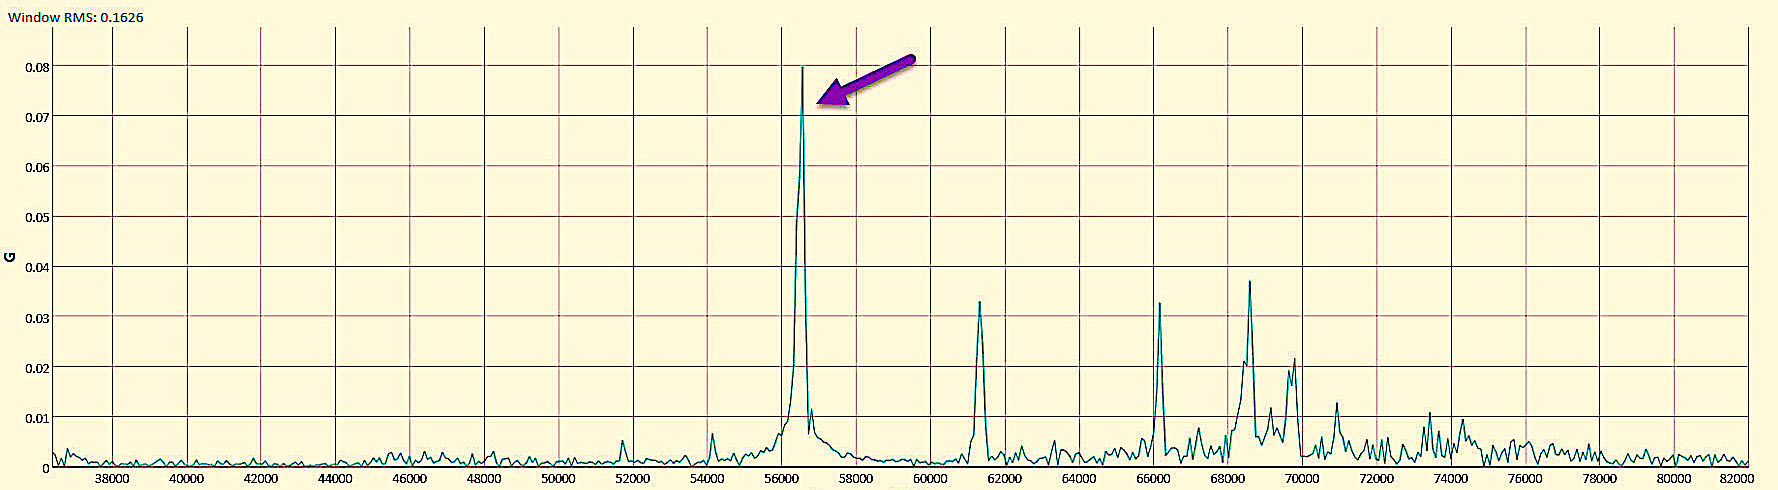
Fig. 6. Vibration analysis of horizontal drive end (DE) in acceleration (g).
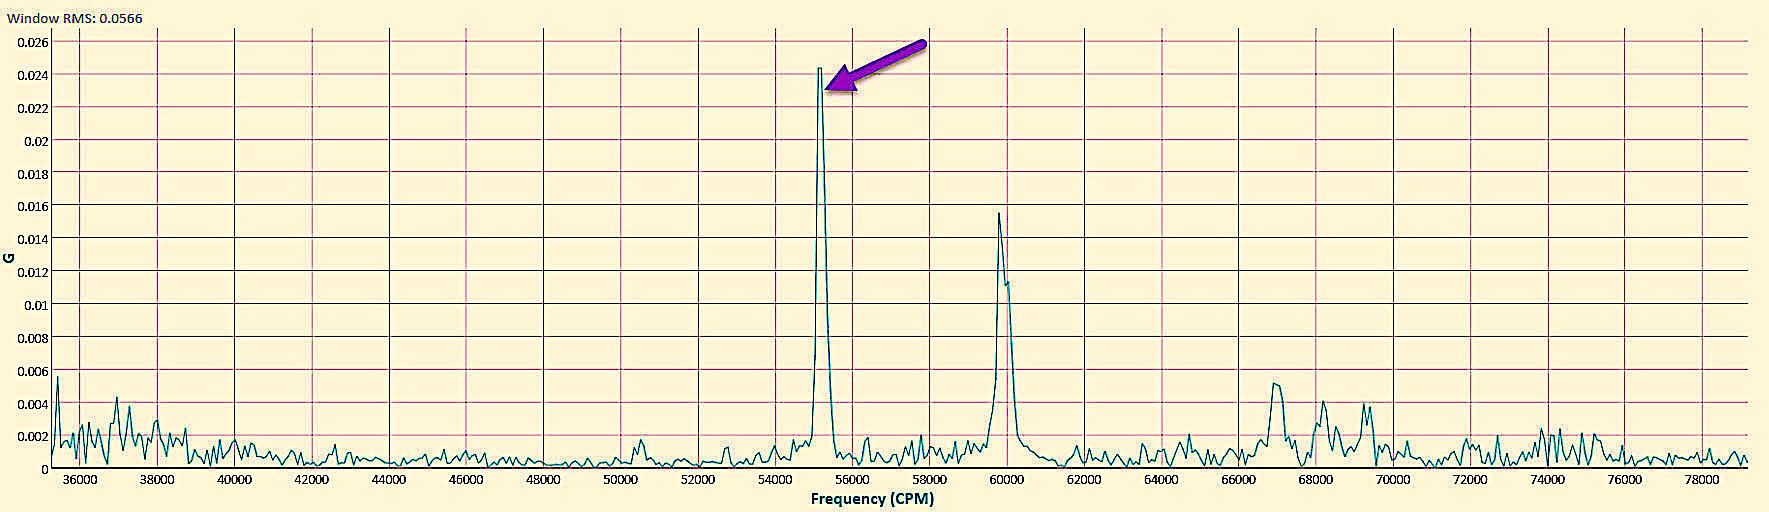
Fig. 7. Vibration analysis of horizontal opposite drive end (ODE) in acceleration (g).
Once the bolts were slightly loosened and data was re-taken, the static eccentricity peaks dropped significantly as shown in Fig. 8. It was also noted that much of the nearby noise peaks disappeared. We estimated that they were most likely other parasitic air-gap vibration that was associated with the stress on the stator and rotor due to the flex of the motor. The associated losses from just loosening the bolts, prior to any other corrections, are shown in Fig. 9.
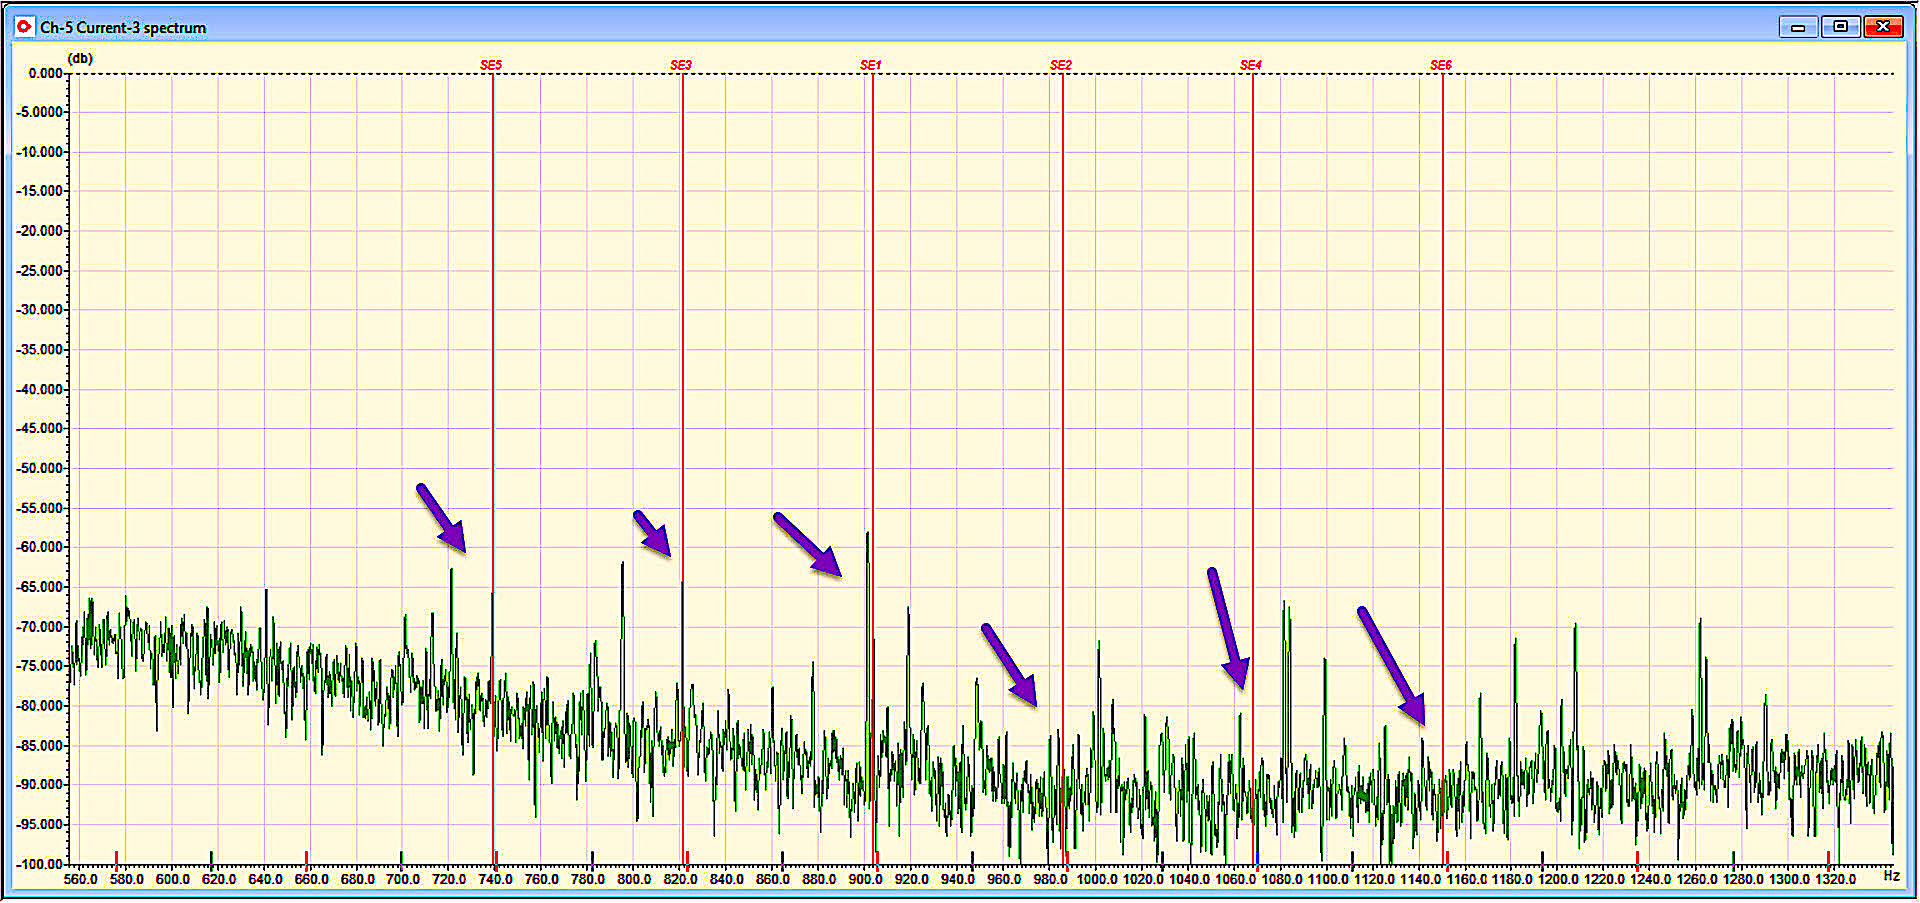
Fig. 8. Static-eccentricity peaks after bolts were loosened. It was noted that nearby noise peaks also disappeared.
Associated losses from just loosening the bolts, prior to any other corrections, are shown in Fig. 9.
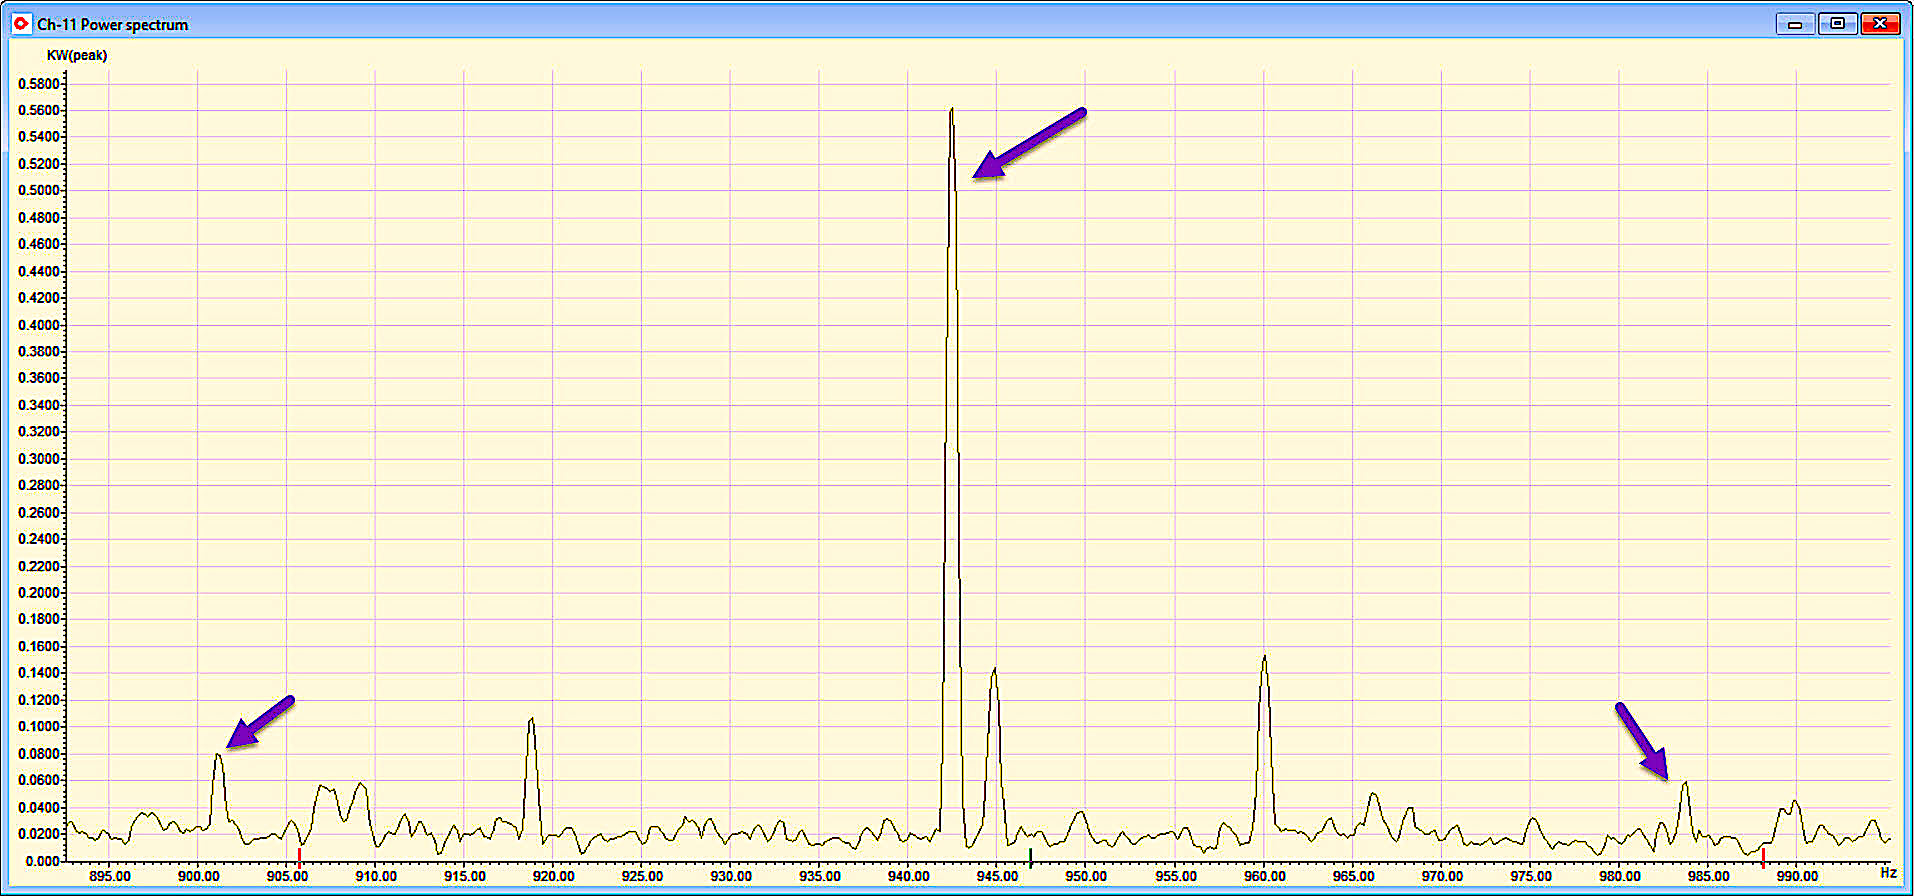
Fig. 9. Static-eccentricity losses following loosening of bolts (0.56 kW + 0.08 kW + 0.06 kW = 0.7 kW).
The results of simply loosening the bolts (shown in Fig. 9 above) indicate that the UMP dropped significantly. We then compared the values to vibration a second time as shown in Figs. 10 and 11.
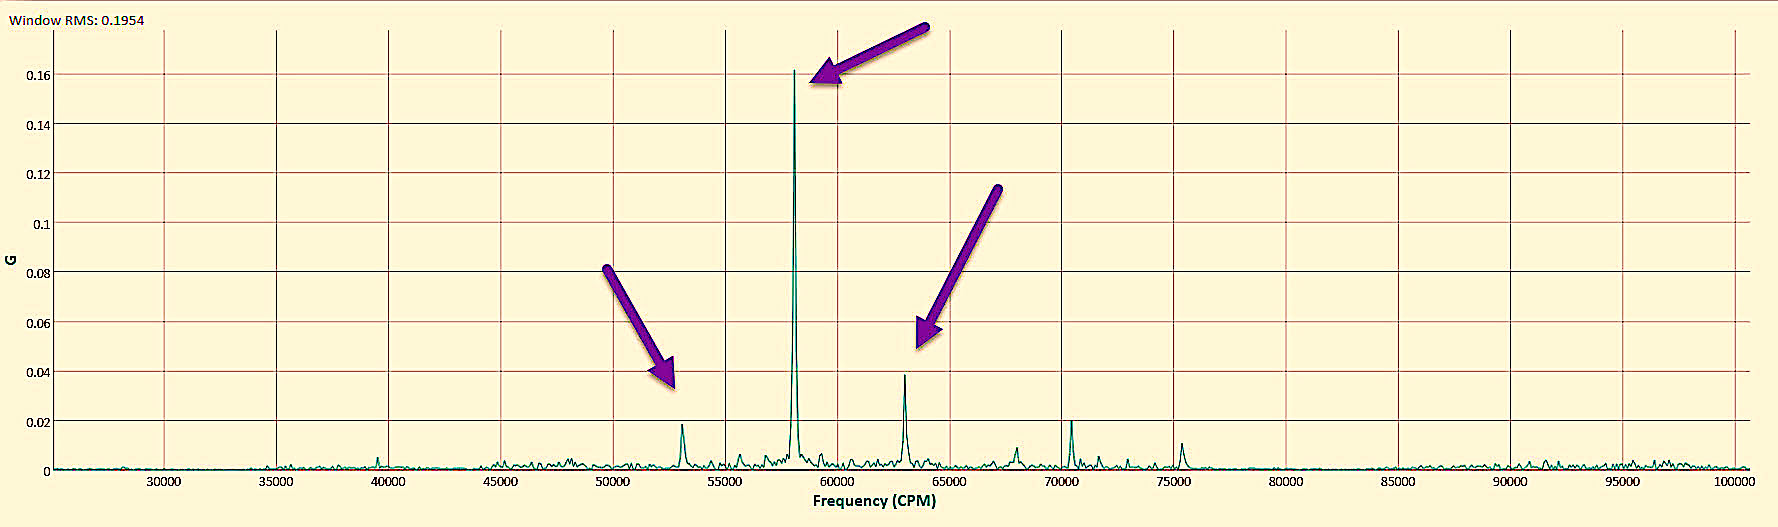
Fig. 10. Vibration analysis of horizontal drive end (DE) in acceleration (g), after loosening bolts.
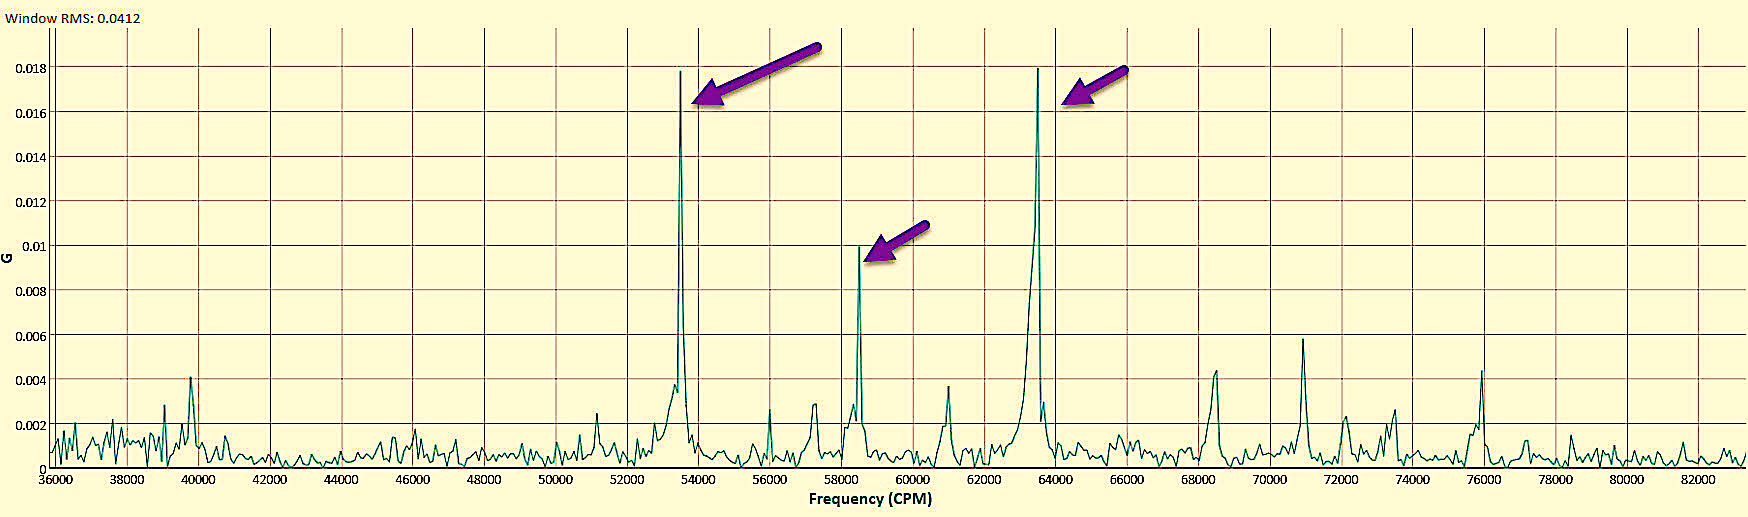
Fig. 11. Vibration analysis horizontal opposite drive end (ODE) in acceleration (g), after loosening bolts.
AMONG THE FINDINGS
One of our observations was that the vibration analysis peaks increased when the static eccentricity was decreased as shown in the original and second set of vibration data. At this point, we can only attribute that to the difference in motor case “tuning” when the bolts were tightened versus loosened (other peaks increased as well). In the second case, the vibration data would probably have raised a few questions. However, when everything was tightened the values would have fallen below the detection threshold.
What does this mean when we consider the reliability of our machinery? In the case of the vibration data, we can fool ourselves into thinking that a fault has been eliminated by “stiffening” the condition. This trick is used to fool the test data when a proper approach to stiffening would actually involve determining where the energy is transferred. In effect, the energy still exists, it just has to be transferred somewhere.
As a result of this study, we see that the equivalent of 1.4 horsepower (1.05 kW) is being absorbed by the motor components due to improper alignment methods. Discussion of the reasoning behind the undersized shim packs that were used for alignment is beyond the scope of this article. However, we would note that when we do find conflicts between vibration data and ESA, they are for similar reasons.
COMING UP
In Part III of this series, we will review the losses associated with improper belt installation, tensioning, and alignment.TRR
ABOUT THE AUTHOR
Howard Penrose, Ph.D., CMRP, is Founder and President of Motor Doc LLC, Lombard, IL and, among other things, a Past Chair of the Society for Reliability and Maintenance Professionals, Atlanta (smrp.org). Email him at howard@motordoc.com, or info@motordoc.com, and/or visit motordoc.com.
Tags: motors, variable frequency drives, VFDs, motor testing, air gap eccentricities, static eccentricity, dynamic eccentricity, air gap defects, air gap faults, rotor defects, reliability, availability, maintenance, RAM, electrical signature analysis, ESA, vibration analysis

