
We’ve all heard the adage “what gets measured gets done.” To be more precise, however, what gets measured gets rewarded, and what gets rewarded gets done. In the April 18, 2021, issue of The RAM Review, I asked this question: “Are you seeking reliability, yet rewarding failure?” A review of your organization’s chosen metrics and key performance indicators (KPIs) can help answer it.
Unfortunately, the KPIs in most organizations are lagging in nature. As I’ve written before, lagging indicators are like driving down the road with your eyes glued on the rear-view mirror. While you have a great view of where you’ve been, you have no optics to let you know where you’re going or what potential hazards you might encounter along the way. This week’s article highlights the difference between leading and lagging metrics and introduces some leading ones that can drive desirable proactive behaviors. In future issues of The RAM Review, I’ll dive into the individual leading KPIs in more detail.
LAGGING METRICS ON THE TOP LINE
As previously stated, lagging metrics reveal where we have been. They represent the scorecard of our performance over a stated period of time. At a very high level, most organizations report return on net assets (RONA) or return on capital employed (ROCE). These KPIs are calculated by dividing the company’s earnings before interest, tax, depreciation, and amortization (EBITDA) by the net operating asset in place (NOAP).
EBITDA is, effectively, a company’s operating profit from the income statement, and NOAP is its true balance sheet based upon the replacement asset value (RAV) of an installation or a group of installations. Some companies will add another component called economic value added (EVA) to the RONA/ROCE analysis for the purpose of determining executive bonuses.
For publicly traded companies, it’s not sufficient to merely generate an accounting profit. The profit must exceed the average return an investor would generate by investing in a balanced mutual fund, for example. If a balanced mutual fund returns 6% per year and a company’s RONA/ROCE is 5% per year, that company will struggle to attract interest in the stock market. Conversely, if a company generates 8% RONA/ROCE, it becomes more interesting to investors. This highly simplified explanation reflects the essence of how value creation is measured.
ASSET MANAGEMENT METRICS THAT DRIVE RONA
Various metrics that feed up to the RONA/ROCE KPI are very much affected by our success in managing the performance of our production assets. On the income statement side, revenue is driven simply by units sold multiplied by average selling price over a specific period of time. As asset managers, we focus on overall equipment effectiveness (OEE), which is the product of multiplying availability, yield, and quality. Let’s explore the relationship between OEE, revenue and EBITDA in some more detail.
Availability is the percentage of hours during which we’re operating divided by 8,760 (the number of hours in a year). Yield is the average production rate divided by our best sustained rate. Quality is simply the percentage of the production that is deemed to be on specification. Availability, yield, and quality all determine the number of units available for sale, and quality affects the average selling price. Other market factors influence demand and price, but they fall outside of the asset manager’s circle of control. In a sold-out market, where suppliers can move everything that they produce, asset OEE performance defines revenue potential. These interactions are illustrated in Fig. 1.
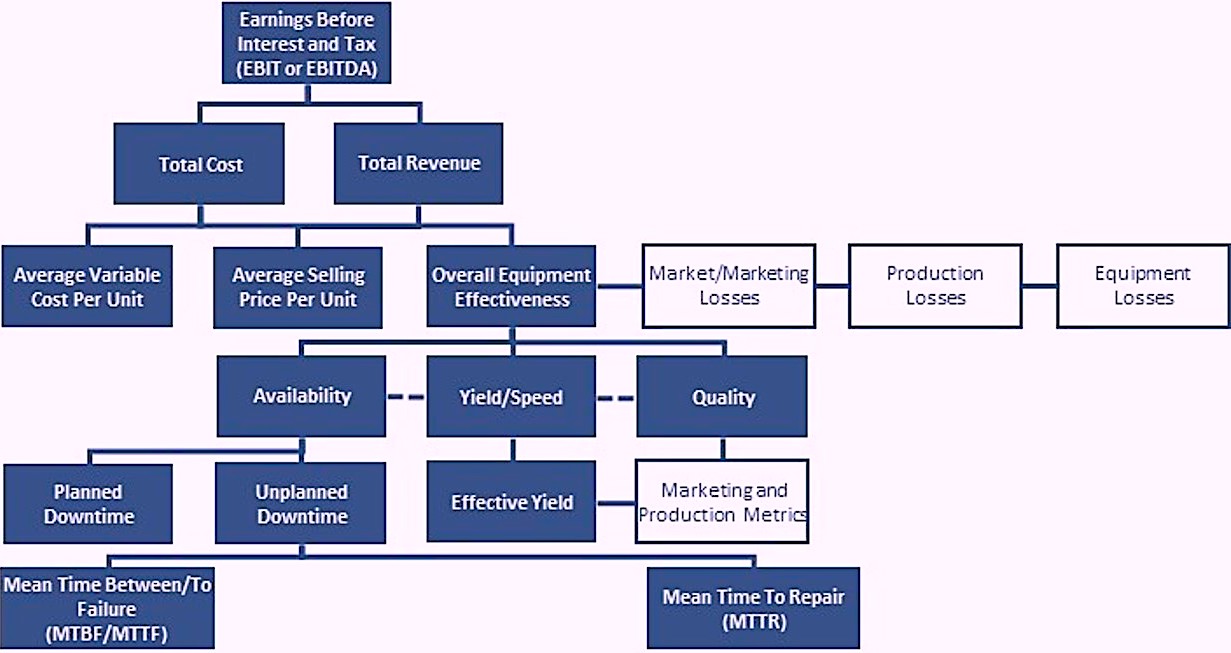
Fig. 1. Illustrated model describing how asset management drives profit (EBIT/EBITDA).
Many asset-management practices influence cost, which, in turn, influences the cost of goods sold (COGS). Those practices tend to focus on how efficiently and effectively we employ direct production materials, labor, replacement parts, and required sustaining capital, which, basically, is maintenance that’s accounted for over a period of years as opposed to in the current production year. A company’s income statement is influenced by all of those costs.
The denominator of the RONA/ROCE equation is the balance sheet. Heavy dependency on duty/standby redundancy, large inventories of critical spares, and a lot of “just-in-case” inventory of parts and materials in the event of an unexpected failure all have a swelling effect on a company’s balance sheet and adversely affect RONA/ROCE performance.
DRIVING BEHAVIORS WITH LEADING METRICS
For asset managers, the key lagging KPIs upon which we focus are mean time between failure (MTBF), or mean time to failure (MTTF) and mean time to repair (MTTR). MTBF and MTTF are effectively the same. We employ MTBF for repairable items and MTTF for items that are simply discarded and replaced. MTTR reflects how long it takes for us to get the plant back up and running. MTBF/MTTF and MTTR performance profoundly affect OEE performance and significantly impact the population of redundant systems, critical spares, and maintenance-parts inventories.
But measuring MTBF/MTTF and MTTR is still looking into the rear-view mirror. We won’t drive improvements in MTBF/MTTF and MTTR until we drive proactive behaviors on the plant floor. For this, I’ve created the set of leading indicators that are laid out in Fig. 2.
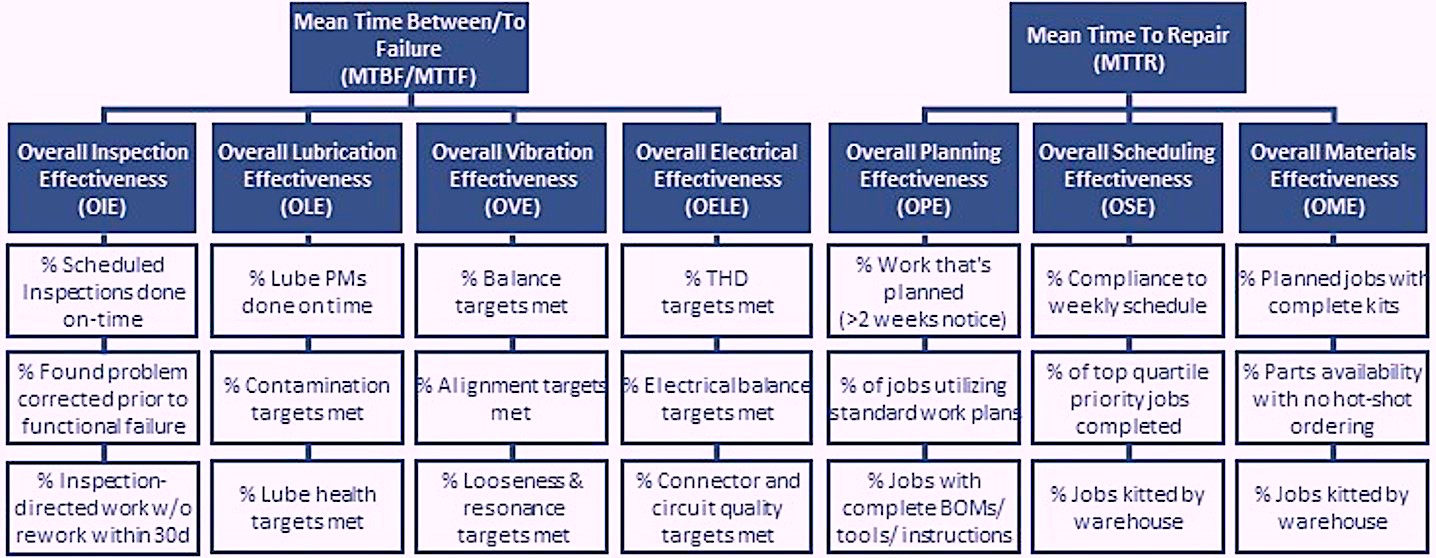
Fig. 2. Leading indicators drive proactive behaviors.
Leading indicators are focused on behaviors that are known to drive MTBF/MTTF or MTTR, which drive OEE and, in turn, RONA/ROCE. They’re leading indicators because they allow us to stop concentrating on “rear-view-mirror” images of the road behind us and begin focusing on the road ahead through a clear, “front windshield.”
Each of the proposed KPIs is written in the style of OEE in the interest of simplicity. For example, overall vibration effectiveness (OVE) is the product of multiplying the percentages of machines in compliance with balance, alignment, and looseness and resonance targets. Simply stated, if OVE increases, then MTBF/MTTR must also increase. When MTBF/MTTR increase, OEE increases and that, in turn, drives RONA.
In short, Fig. 2 illustrates seven key leading asset-management metrics that, if addressed proactively, will drive improvements in your MTBF/MTTF and MTTR. As mentioned previously, I’ll address these individual KPIs in future articles for The RAM Review.TRR
ABOUT THE AUTHOR
Drew Troyer has over 30 years of experience in the RAM arena. Currently a Principal with T.A. Cook Consultants, he was a Co-founder and former CEO of Noria Corporation. A trusted advisor to a global blue chip client base, this industry veteran has authored or co-authored more than 250 books, chapters, course books, articles, and technical papers and is popular keynote and technical speaker at conferences around the world. Drew is a Certified Reliability Engineer (CRE), Certified Maintenance & Reliability Professional (CMRP), holds B.S. and M.B.A. degrees, and is Master’s degree candidate in Environmental Sustainability at Harvard University. Contact him directly at 512-800-6031 or dtroyer@theramreview.com.
Tags: reliability, availability, maintenance, RAM, metrics, key performance indicators, KPIs, workforce issues

