
Continuing with my “Reliability Resolution 2020” theme on TheRAMReview.com, this final installment of a three-part series brings together the machine-life-extension benefits described in the first series installment (Jan. 4, 2020) with the energy-savings benefits discussed in the second installment (Jan. 11, 2020) to create a business justification for investing in precision maintenance.
Click Here to Read the Jan. 4, 2020, Series Installment
“Focus on Precision Maintenance for Machine Life Extension”
Click Here to Read the Jan. 11, 2020, Series Installment
“Drive Environmental Sustainability with Precision Maintenance”
ESTIMATING THE BENEFITS
Before diving into our precision-maintenance-justification example, let’s discuss some fundamentals of cost-benefit analysis for investments in asset reliability improvement. Referring to Fig. 1, there are several principles to observe:
- The true cost of a failure can’t be deterministically defined until AFTER the failure event, when it’s too late.
- Efforts to detect failures, (e.g., predictive monitoring), prevent collateral damage, and plan and schedule corrective interventions will reduce the severity of each failure event.
- Efforts to design for reliability, maintainability, and operability, operate the equipment within acceptable levels, and proactively maintain the equipment to reduce vibration, noise, and heat (e.g., precision maintenance) will reduce the number of failures per year.
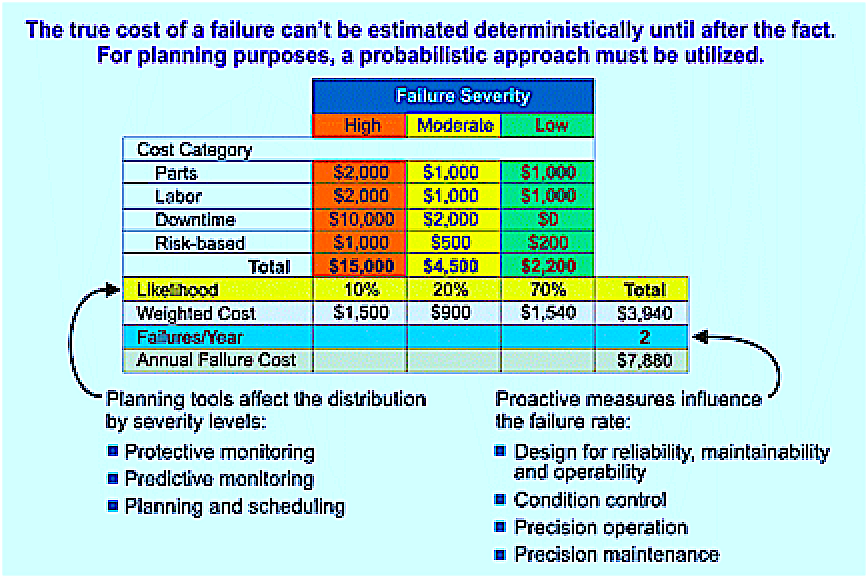
Fig. 1. Investments to improve the reliability of plant assets focus on reducing the severity of each
failure event and/or reducing the number events that occur per year. Often, you can achieve both.
(Ref: Plant Reliability in Dollars & $ense Workshop – Drew D. Troyer, CRE).
Unless you have a crystal ball, forget about getting perfect data to predict the economic benefits of an investment in asset reliability. While we employ as much deterministic and empirically derived data as is available, at some point we need to move forward using the best information at hand. We must simply get comfortable with the fact that we don’t always have perfect data.
Our predictive monitoring tools and maintenance-work management methods for planning, scheduling, and coordinating work reduce the severity of each failure event, but they don’t necessarily reduce the number of failures we see over a given amount of time.
Consider Table I. In this example, we estimate that the failure cost for a machine has three severity levels: high, moderate, and low.
The high- severity event carries the greatest cost, which is primarily attributable to downtime. The moderate scenario has similar repair costs, but a much lower impact on productivity. The low-severity scenario has lower repair costs and no impact on downtime.
In our example, we estimate that 10% of the events are severe and 30% are moderate, which leaves minor events making up 60% of the failure scenarios. Calculating the weighted average cost per event, we estimate the current annual unreliability cost to be $4,270.
Let’s assume that we implement vibration analysis, oil analysis, thermography, ultrasonic analysis, sensory inspections, or other methods to provide an early indication that the machine has a fault and a failure is eminent; and that we employ planning and scheduling tools to ensure the necessary parts and tools are on hand, maintenance instructions are created, and machine access is negotiated with production. We estimate that these interventions will rearrange the severity distribution so that only 3% of the events are high severity, 5% are moderate severity and 92% are low severity, reducing the weighted average cost per event to $2,627—a savings of $1,643 per event—which is a reduction of 38%.
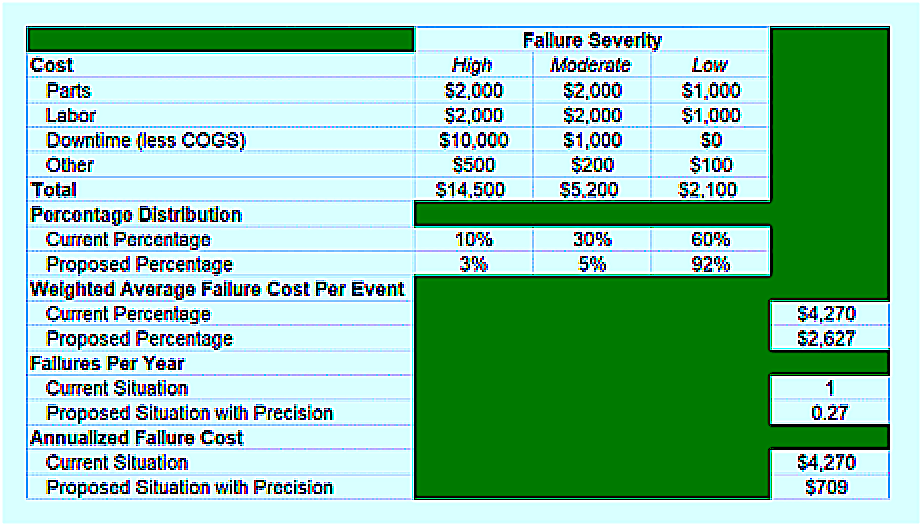
Table I. Summary benefits analysis for a reliability-improvement initiative.
In the first published installment (Jan. 4, 2019) of this “Reliability Resolution 2020” series, I suggested a scenario of proactive intervention for reducing vibration, noise, and heat generation by focusing on the mechanical and electrical aspects of fasteners, lubrication, alignment and balance (FLAB). In that example scenario, we increased the mean time between failure (MTBF) from 12 to 44 months (Table II of the Jan. 4, 2019, article) . This proactive intervention reduces the failure rate from 1.0 to 0.27 per year. Assuming that we implement both the predictive and proactive (precision) interventions, in our example, the annual failure cost is reduced from $4,270 to $709—a significant improvement.
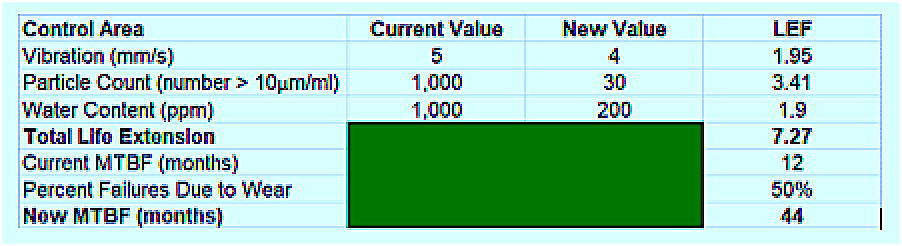
Table II. Life Extension Factor (LEF) opportunity from a precision maintenance intervention, based upon FLAB
(from first installment [Jan. 4, 2020,] of this “Reliability Resolution 2020” series).
NOW FOR THE COST-BENEFIT ANALYSIS
It’s not enough to estimate the benefits of an investment in asset reliability improvement. It’s got to make sense on the bottom line when we compare the benefits to the cost.
An important concept to cost-benefit analysis is the time value of money. In essence, a dollar is worth more today than at any point in the future, and the discount of a future cash flow depends upon the cost of capital. Figure 2 provides the general equation and illustrates an example where $1,000 received five years in the future, at a cost of capital of 10% per year, has a present value of $621 in today’s dollars.
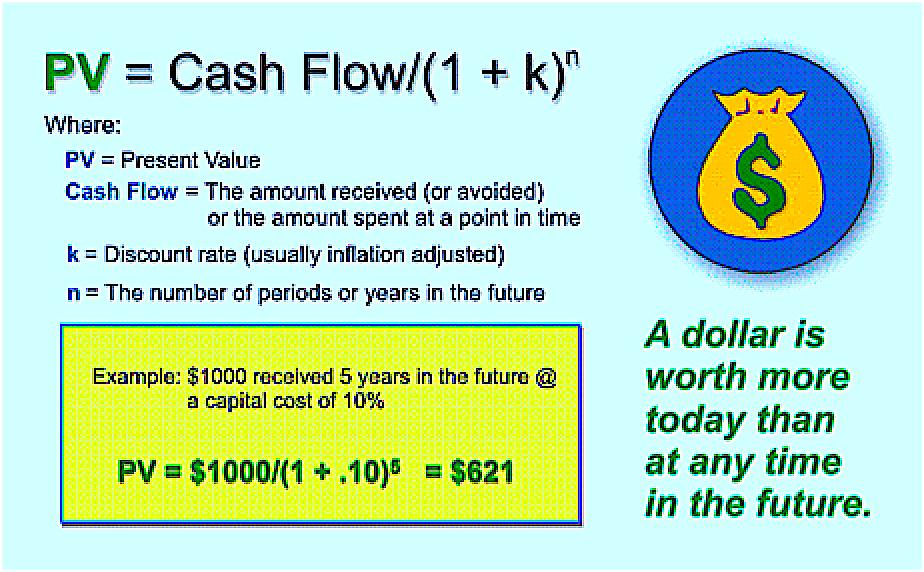
Fig. 2. The time value of money—calculating the present value of a cash flow.
(Ref: Plant Reliability in Dollars & $ense Workshop – Drew D. Troyer, CRE).
In our example, we have estimated that we can reduce our annual unreliability cost from $4,270 to $709 for a savings of $3,561—that’s the benefit. However, we must consider a number of costs. Such costs could include:
- equipment modifications to reduce vibration, lubricant contamination and to improve lubrication effectiveness
- tools required for machine condition monitoring and precision maintenance (apportioned)
- investments in software and people to improve work management, parts quality management, etc. (apportioned)
- training, coaching, and mentoring support to produce a culture change (apportioned)
- reliability engineering (apportioned)
- management and supervision (apportioned).
Let’s make the following assumptions in our example:
- We have 20 machines of the type included in our analysis.
- The upfront cost to modify each piece of equipment for precision maintenance is $2,500.
- The ongoing cost to support the modifications is $250 per unit per year.
- The apportioned upfront cost for tools, training, systems, engineering, and management support is $500 per unit.
- The apportioned ongoing cost for tools, training, systems, engineering, and management support is $100 per unit per year.
- First-year benefits will be discounted by 50%. Second-year benefits will be discounted by 25%. We sometimes discount the first-two-years’ benefits to reflect the time required for full implementation of the changes.
- We’re conducting a five-year cost-benefit analysis.
- Management is charging us a 12% cost of capital to underwrite the investment.
- Management has requested that we limit our economic analysis to the hard benefits, but suggested that we include the soft benefits, such as reducing GHG emissions and the the associated social cost of carbon in our report.
- Management has requested that we analyze the hard benefits utilizing the following:
- Net present value (NPV) —the total value of the project in today’s dollars.
- Internal rate of return (IRR) —the effective interest rate of the investment’s return.
- Discounted payback period—the time required to recover the invested dollars using discounted future cash flows.
Now that we have our assumptions and our marching orders from management, we’re in a position to tabulate our cost-benefits analysis.
The findings of our cash-flow analysis are summarized in Table III below.
Our proposed project provides a healthy five-year NPV of over $600,000. This number represents the increased profit to the firm over the first five years of the investment’s life discounted to reflect the value of money today. That’s not to say that our precision-maintenance intervention won’t continue to yield benefit after five years —there’s every reason to believe that it will. However, we’re limiting our planning horizon to five years because the future can be very uncertain.
The IRR is 220%, which means that we would have needed to find a bank that could pay us an annual interest rate of 220% to match the quality of this investment.
Finally, this discounted payback period is 0.61 years, which means that we’ll recover all the invested money in 7.3 months—a pretty good investment indeed.
In the report, we’d certainly highlight the fact that we believe that our precision-maintenance initiative is expected to reduce our carbon footprint by 440 metric tons of CO2 per year—a reduction in the social cost of carbon of more than $20,000 per year. However, we frequently make note of these types of improvements in the report as positive externalities, while excluding them from the quantitative cost-benefit analysis.
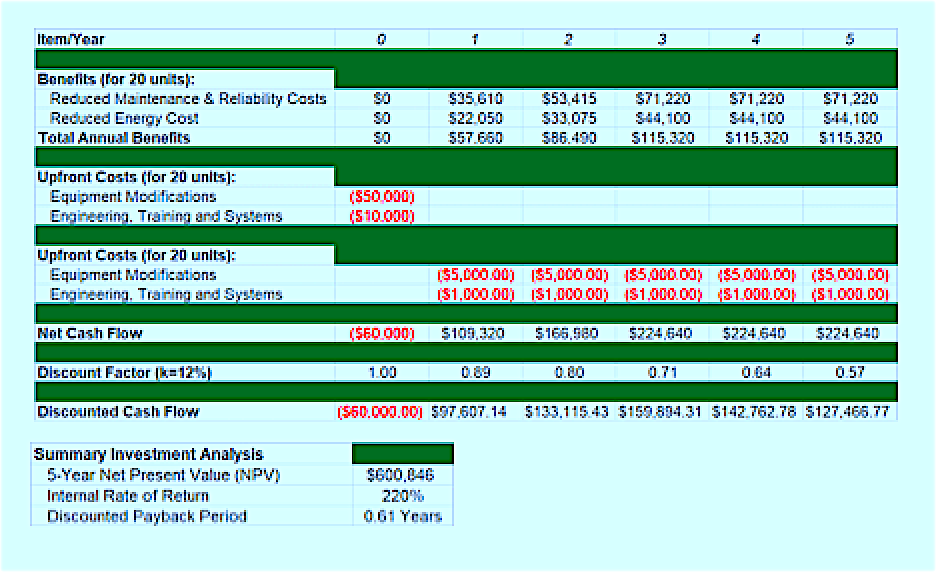
Table III. A summary of our cost-benefit analysis.
As I conclude this three-part “Reliability Resolution 2020” series, I again encourage you to take my challenge and test opportunities for increasing equipment life, reducing maintenance and operating costs (including energy costs), and minimizing your organization’s environmental footprint through precision maintenance.
A good place to start is by revisiting my article, “Optimum Reference States for Precision Maintenance” (published Dec. 22, 2019, on TheRAMReview.com). In it, I listed approximately 70 optimum reference states (ORS) for precision maintenance with regard to fasteners, lubrication, alignment, and balance (FLAB).
Click Here to Read the Dec. 22, 2019, Article
“Optimum Reference States for Precision Maintenance”
Once you taken another look at the information in that Dec. 22, 2019, article, follow the business-justification recipe I’ve laid out here so that you can communicate your findings in Dollars & $ense.
Have a Happy and Reliable New Year!TRR
ABOUT THE AUTHOR
Drew Troyer has 30 years of experience in the RAM arena. Currently a Principal with T.A. Cook Consultants, he was a Co-founder and former CEO of Noria Corporation. A trusted advisor to a global blue chip client base, this industry veteran has authored or co-authored more than 250 books, chapters, course books, articles, and technical papers and is popular keynote and technical speaker at conferences around the world. Drew is a Certified Reliability Engineer (CRE), Certified Maintenance & Reliability Professional (CMRP), holds B.S. and M.B.A. degrees, and is Master’s degree candidate in Environmental Sustainability at Harvard University. Contact him directly at 512-800-6031 or dtroyer@theramreview.com.
Tags: reliability, availability, maintenance, fasteners, lubrication, alignment, balance, vibration, energy efficiency, energy costs, cost-benefit analysis

