If you follow topics on reliability, you may have the impression that all equipment is born, lives, and dies in the same pattern as Europeans in the 17th century. That would be with a high rate of death at birth and during their early years, average across the middle years, and at an increasing rate in their later years.
That 17th-century European life-cycle pattern is representative of a bathtub curve, which began as an actuarial chart and was eventually adopted into industrial and reliability engineering practice by observation. The concept has been that the “infant mortality” portion of the curve represents a high rate of failure due to product defects that then drops to a constant number of failures during useful life until the period of wear out due to age (Fig. 1). While most studies indicate the bathtub curve is rare in practice for equipment and technology, it’s frequently used to represent decreasing, constant, and increasing hazard rates over the life of systems.

Fig. 1. Common failure curves used in reliability,
including the bathtub curve.
The hazard rate is the rate of death or failure at a specific point of time. This can also be represented as the chance of instantaneous failure at a specific time. As a result, the bathtub curve shows a high hazard rate (or failure rate) at birth and death and is normally logarithmic.
Again, to be clear, as with the bathtub curve, reliability and industrial engineering take the lead from actuarial and health sciences for methods and calculations such as what has been referred to as the P-F curve (Fig. 2). The original concept of the P-F curve was to identify a detectable triggering event along the useful life portion of a bathtub curve (P) and the survival rate to a point of defined failure (F). This was then applied in Reliability Centered Maintenance (RCM) processes through NAVSEA (USA Naval Sea Command) to determine detection test rates as half the time between P-F to increase the probability that the defect is caught prior to failure. NAVAIR (USA Naval Air Command) applied a different approach to increasing the probability of detection prior to failure further by increasing the frequency of testing between points P and F depending on the impact.
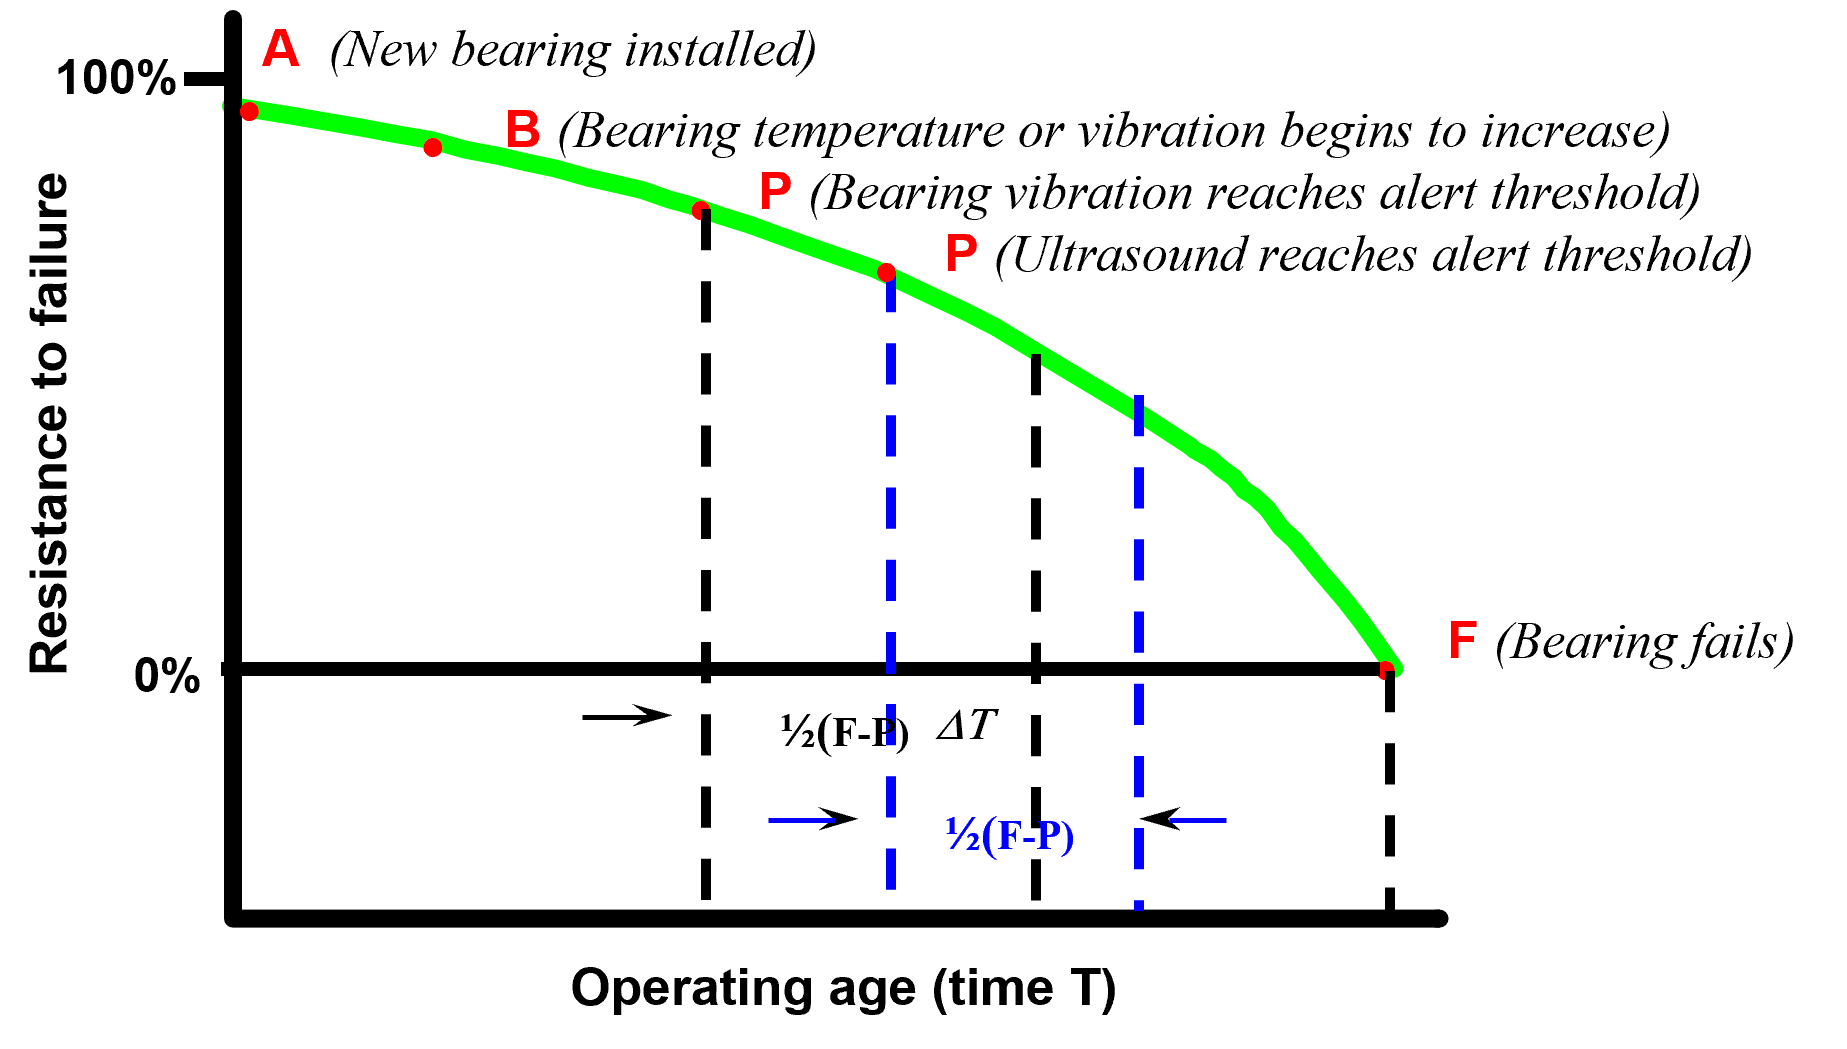
Fig. 2. P-F Curve and testing frequency.
As we move further into the realm of Physical Asset Management (PAM) health, the application of correct failure curves becomes even more important, especially if we’re looking to forecast useful life of a system prior to application or Remaining Useful Life (RUL) once a system is in operation. This becomes extremely important in such concepts as Artificial/Augmented Intelligence (AI) and Machine Learning (ML) for predictive-maintenance purposes, where we again borrow from healthcare using the same methods for calculating patient survival. We use the same methods for detecting such things as survival of cancer patients from the point of testing, considered as 100% survival (alive) at that point in time and forecasting the probability of surviving longer than time (t) based upon a population (theoretically a smooth curve).
Healthcare will use tools such as the Kaplan-Meier Plot for Hazard Rate (Fig. 3) for single points of data, not including intervention; and the Cox Proportional Hazard Regression, which implements covariates such as intervention, application, and other conditions and information. Beyond those tools, there are, among other things, Tree-Structured models, including “Random Forests” that provide some of the basis for Neural Networks (NN) and all the associated variations. The tree-structured approach is much like decision trees in engineering.
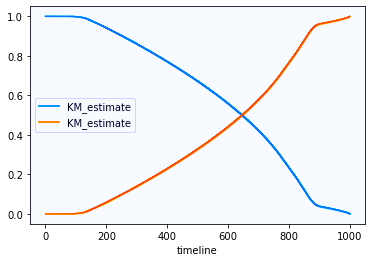 Fig. 3. Kaplan-Meier Plot for Hazard Rate (gold) and
Resistance to Failure (blue) for a VFD-driven fan.
In all cases, the survival rate of PAM-related equipment requires observation and known or theoretical failure rates of existing or modeled equipment. In manufacturing processes, this analysis is often performed using accelerated failure testing and/or computer models, including ML, based upon component accelerated failure testing or historical values. This analytical approach provides greater levels of confidence in determining the useful life of products in development (also referred to as “predicting” or “estimating” useful life). Information on failure is gathered after a product or system is implemented to provide more accurate models, improve the asset, and/or for use in future product data.
The next level of RUL is in application where the reliability engineer or technician applies known failure rates of specific or similar equipment to data collection and observation. This is the challenge that most predictive-maintenance personnel run into at some point: a lack of data for forecasting failure AND a widespread misunderstanding of the term “predictive maintenance” (PdM). When asked if something will last a specific length of time, the immediate assumption is that the response must be 100% survival to that point. That’s extremely unlikely, even when historical survival data is provided.
In reality, the proper approach is to use a method based on available data to provide the probability that the equipment will survive to some point in time. A Kaplan-Meier type of response would be, “Based on prior history, there is a 40% chance of survival to that point.” (A Cox Proportional Hazard type of response would be, “If we derate the equipment to ‘X,’ then there is a 60% chance of survival to that point.)” In effect, the use of probability becomes a tool in the hands of the reliability engineer or predictive-maintenance specialist.
NOTE: There are, of course, more regression models than those that have been highlighted in this article. One of the most common and simplest of them is KNN (K-nearest known neighbor), where multiple data points (K) are matched to a survival table and the nearest data is used for probability. Another is the ARIMA (Autoregressive Integrated Moving Average) model that uses a “window” of data to forecast future data based on past information and is exceptional when applied to “seasonal” pattern information. The models used in this article are “linear regression” types that are simpler than “non-linear” methods. We’ll cover non-linear-regression models in our next article.
There are times when no history exists and the reliability or PdM specialist must respond to the question, “How long will it last?” This requires some level of expertise as estimates and probabilities are determined on the experience of the person or team, which determines the confidence of the prediction. At these points, the use of approaches such as TTFE (Time to Failure Estimation) come into play and a level of probability can be termed as likelihood of survival. We often leave out the concept of “gut feeling” when providing responses, as most engineers and other technically minded people tend to be risk averse. For them, “not likely, “highly likely,” or “50-50” can be effective types of responses, particularly if they begin with, “In my opinion.”
For example, an electric-motor bearing has an unknown failure rate, and a random period of quarterly testing is performed. The technician conducts vibration analysis on the bearing and notices that peaks related to the inner and outer race frequencies are starting to form. He/she notes this in the morning meeting the following day, and the supervisor, who has to report findings to management, asks “How bad is it?’ They review the data and see that no prior signature exists, and the change is slight. What can they do?
One approach would be to continue trending the data until a distinct pattern emerges. This would normally be completed by increasing the frequency of testing and, once a curve is identified, informing decision-makers that action must be taken as ASAP. Another approach would be to let decision-makers know the condition exists and that, for example, it is “most likely” at the beginning of failure. The decision-maker(s) may ask if the bearing will last a specific length of time and, thus, avoid an unplanned outage until the next planned one. The response can be an increase in testing frequency combined with a response of “most likely,” or “most likely if we do ‘X’.” When introducing the probability approach, which is the purpose of predictive maintenance and reliability engineering, numerous options are available. When fixed on absolutes, the problem becomes more complex and, usually, expensive.
The use of AI and ML for predictive maintenance provides an automated approach to probability statistics for asset health. In the realm of PAM, most of these approaches require training data for proper forecasting and classification (identification) of faults, which are based on the first two approaches (known data or modeled/accelerated data) above. Very few can perform, based on the example given, and will usually only provide deviation from known operating conditions (unsupervised models) or classifications (supervised fault patterns) with limited regression at a specific point in time.
As technology continues to move toward increased reliability of automated IoT systems, the example provided above will be the most likely approach for legacy equipment. To accomplish it, reliability and predictive-maintenance personnel must be familiar with failure curves for different types of equipment and testing frequencies based on the P-F curves for different fault types. Those individuals must also understand and be comfortable with the use of probability and statistical concepts over the concept that everything must be conveyed in absolutes.
As noted previously, next week, we’ll discuss non-linear failure- and hazard-rate curves, and where they exist in PAM and ML. These are typically applied to electronics, insulation systems, and complex systems within facilities, whereas the types of linear-regression methods that have been discussed in this article apply to individual equipment, wear objects (such as bearings), and similar components.TRR
Click The Following Links For Parts I And II Of This Short Series
“Part I, The Possibilities Of Probability: In Reliability And Predictive Maintenance” (Nov. 6, 2021)
“Part II, The Possibilities Of Probability: In MTBF” (Nov. 15, 2021)
ABOUT THE AUTHOR
Howard Penrose, Ph.D., CMRP, is Founder and President of Motor Doc LLC, Lombard, IL and, among other things, a Past Chair of the Society for Reliability and Maintenance Professionals, Atlanta (smrp.org). Email him at howard@motordoc.com, or info@motordoc.com, and/or visit motordoc.com.
Tags: reliability, availability, maintenance, RAM, electrical systems, predictive maintenance, Artificial/Augmented Intelligence, AI, Machine Learning (ML), Internet of Things, IoT, P-F Curve

