Considerable attention has been given to the application of Electrical and Motor Current Signature Analyses (ESA and MCSA) in motors and generators. But little in the way of research has been published on the use of ESA with transformers. From an operational perspective, a transformer is basically an induction motor with a stationary secondary (rotor). This means that many conditions in dry and oil-filled transformers can be analyzed. In this series of articles, we’ll focus on the application of ESA in transformer analysis and discuss its present capabilities and limitations with this caveat: Continued research will be leading to new capabilities in the coming months and years.
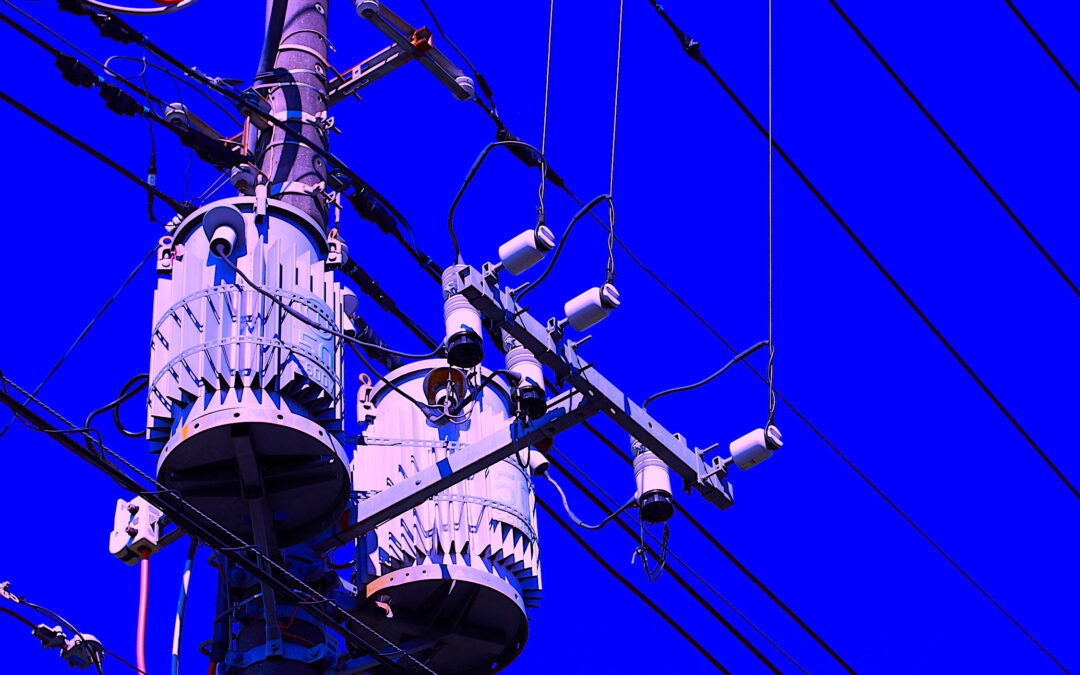
As part of a long-term neutral harmonic energy impact study described in “Energy & Reliability With A Neutral Harmonic Filter”| The RAM Review, an ECMS-1 continuous-monitoring ESA system was installed on a lighting panel for continuous monitoring purposes (Fig. 1). The 480-Vac panel serving the facility’s 277 Vac lighting system is served through a breaker directly to three pole-mount transformers. The lighting circuit is divided into a balanced 277 Vac lighting load with an expected maximum load of 20 Amps per phase. Several weeks after the monitoring system’s installation, the alert system was connected and began delivering notifications of a loose connection in Phase 3 during certain times of the day and operating conditions. (Fig. 2).
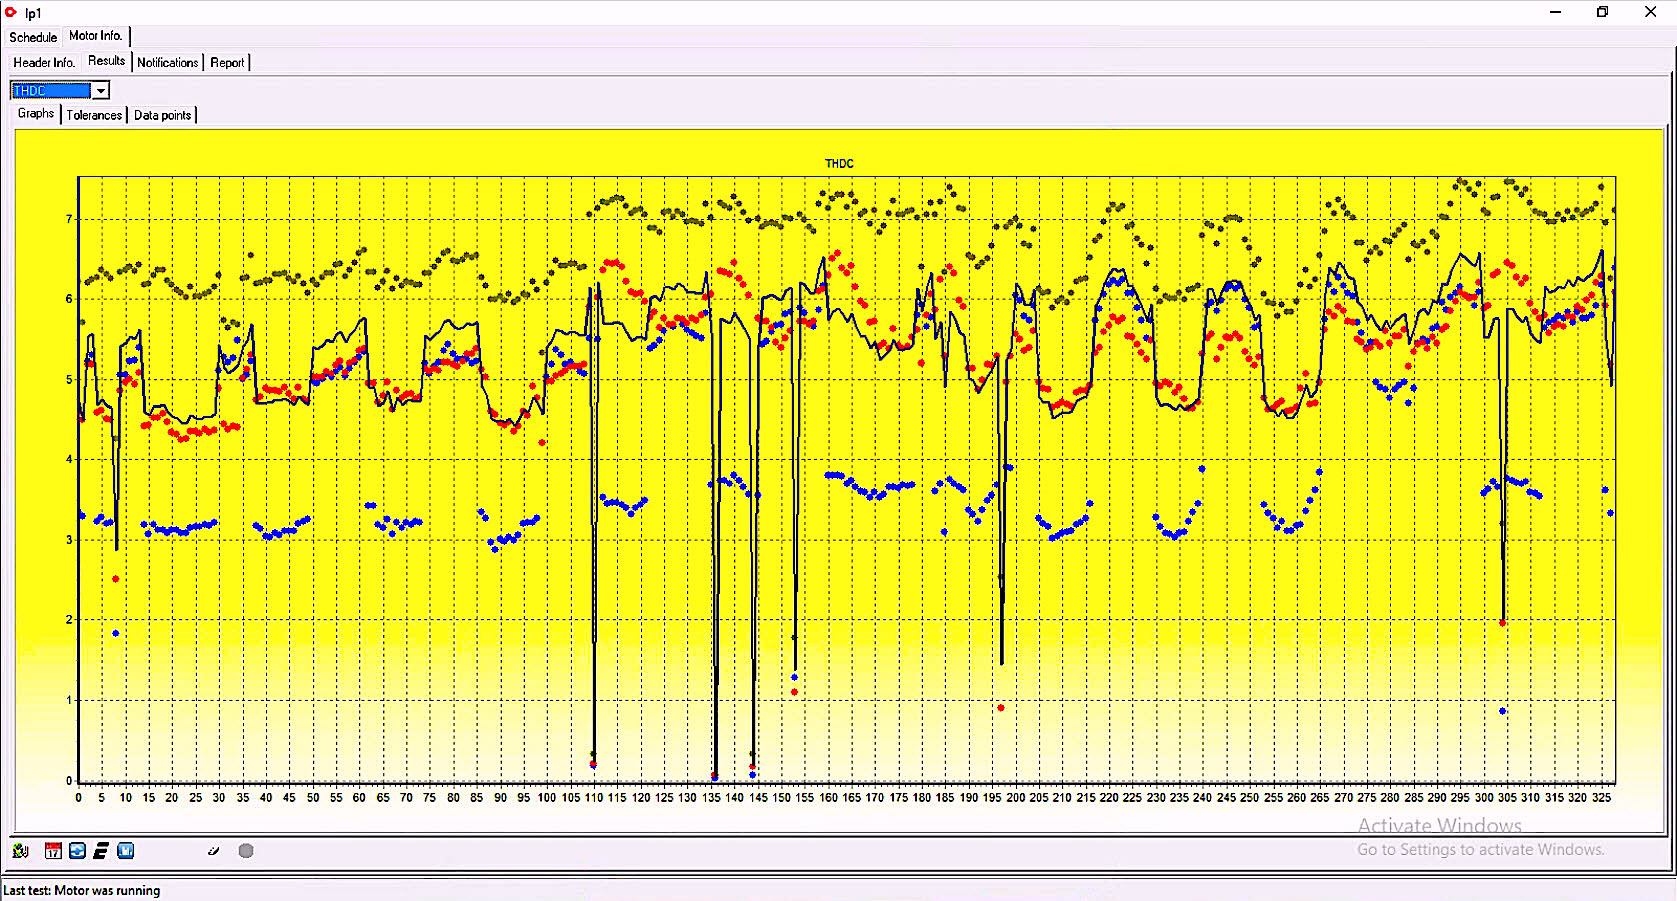
Fig. 1. Continuous monitoring of total harmonic-distortion current.
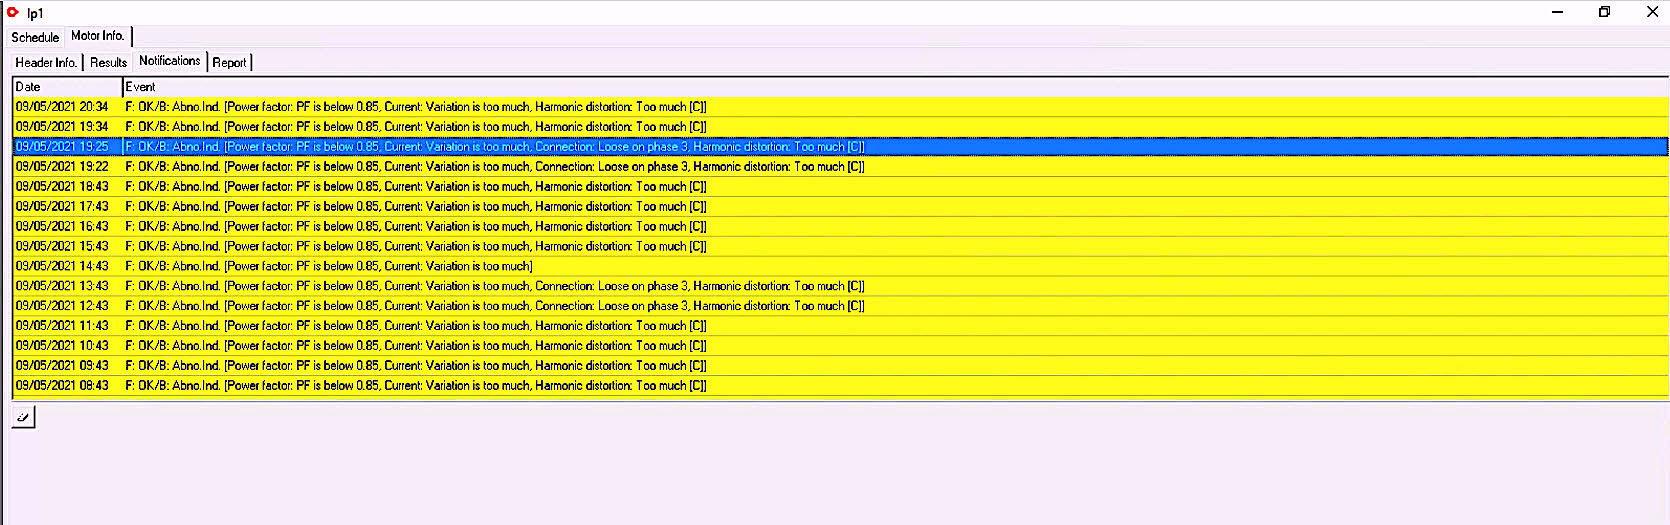
Fig. 2. Alerts in the continuous monitoring system.
The investigation started with remote analysis of the data that identified significant unbalance during the times that the-loose connection signature was noted (as shown in Fig. 3). As identified in Fig. 4, the power factor is already low, since it represents the “True Power Factor,” which includes current harmonic distortion. (For more information on power factor, see “The Mysterious Power Factor” | The RAM Review.)
Fig. 3. Evaluation of ESA prognostic data on the transformer.
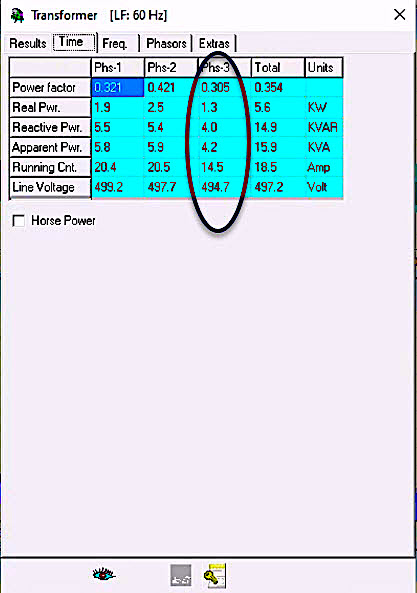
Fig. 4. Per phase data from ESA on the lighting panel.
A review of the voltage and current waveforms in Fig. 5 shows that Phase 3 is shifted and has much lower peak to peak amplitude. The notching in current seen in this figure is related to power harmonics and depicted as the sidebands around line frequency, harmonics, and subharmonics shown in Fig. 6, which only appeared during the purported “loose connection” incidents. The subharmonics are in ¼ line frequency increments (15Hz, 30Hz, 45Hz) with sidebands of 0.536 Hz.
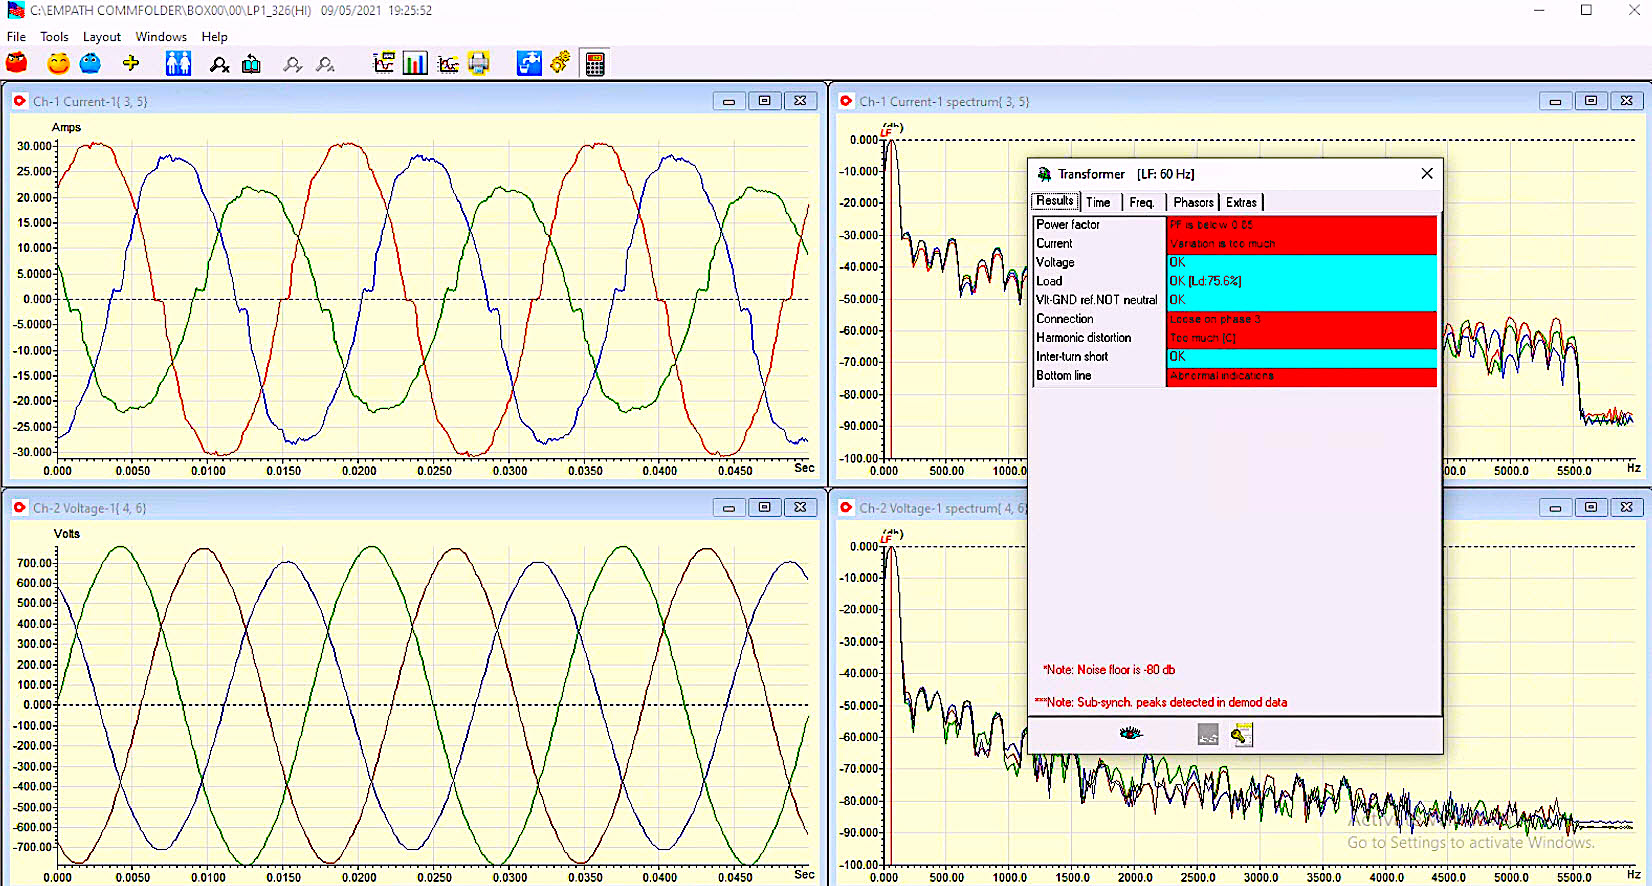
Fig. 5. Blue is Phase 1; red is Phase 2; green is Phase 3.
Top is current in amps p-p; and bottom is voltage p-p.
Poor power factor results in a dramatically out-of-phase voltage and current.
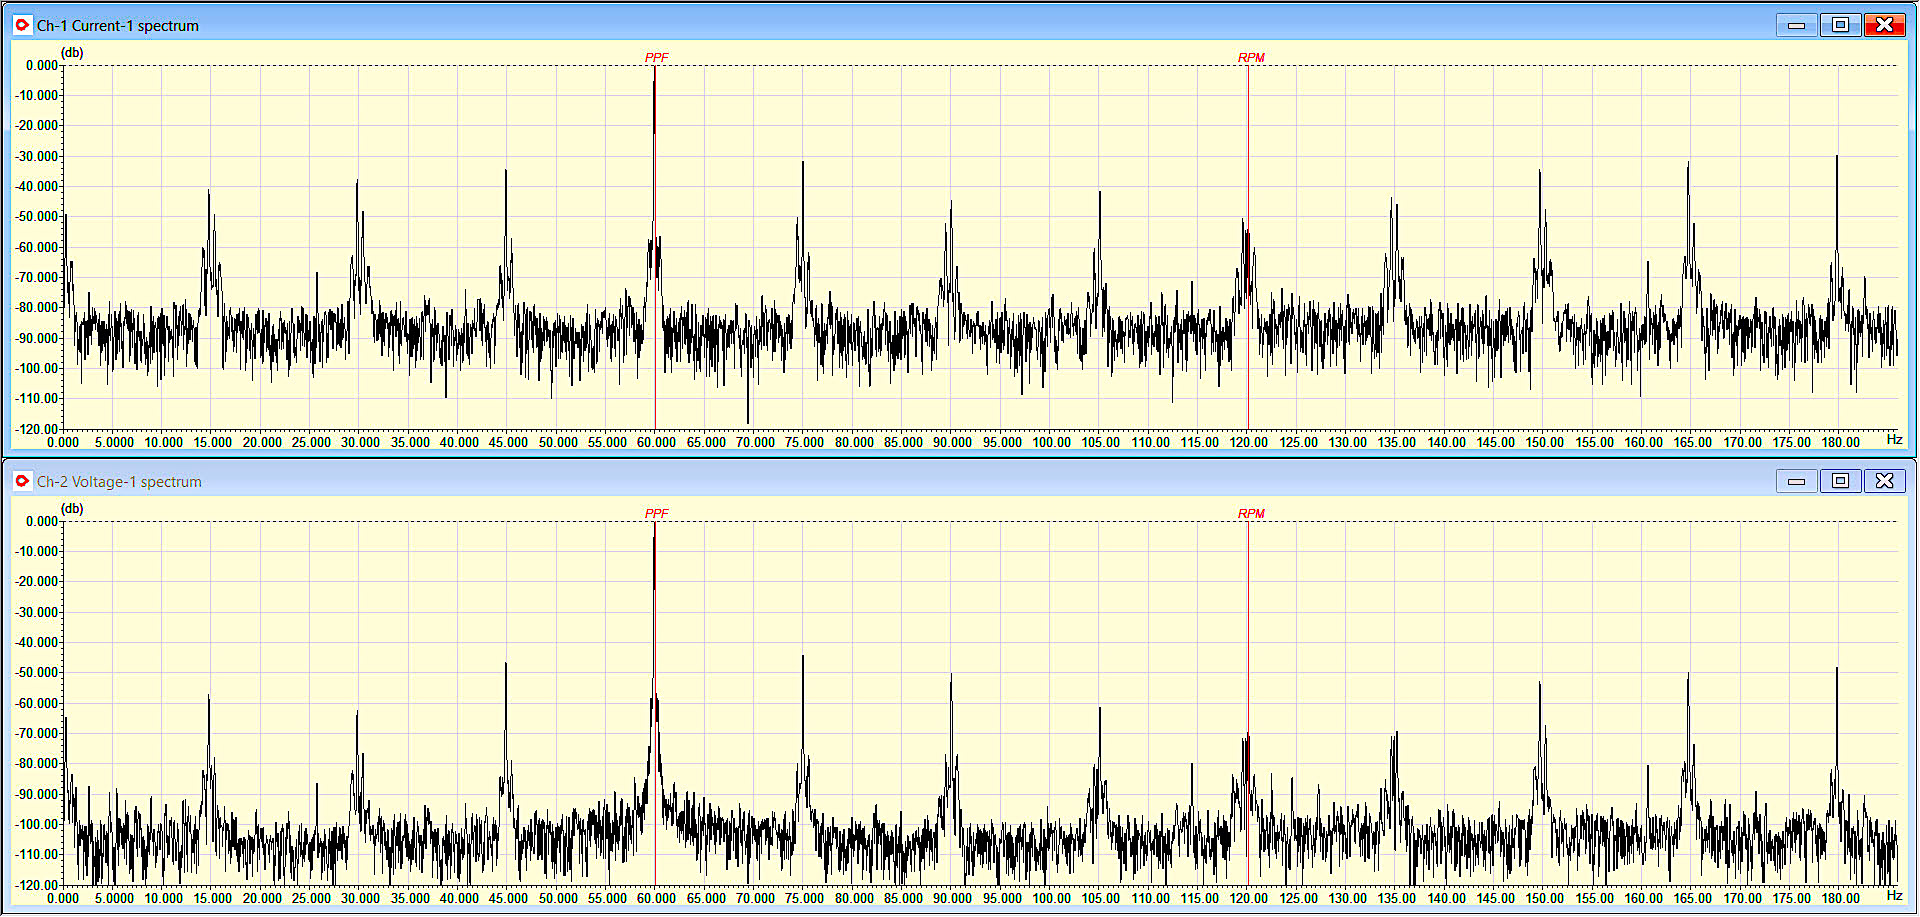
Fig. 6. Current (top) and voltage (bottom) low-frequency data set.
15Hz, 30Hz, and 45Hz sub-harmonics.
The loading was evaluated, as shown in Fig. 7, and found that indication of a “loose connection” appeared under heavier loads. A review of the current and voltage harmonics (Fig. 8) showed that even harmonics were present, which pointed to an issue with the transformer.
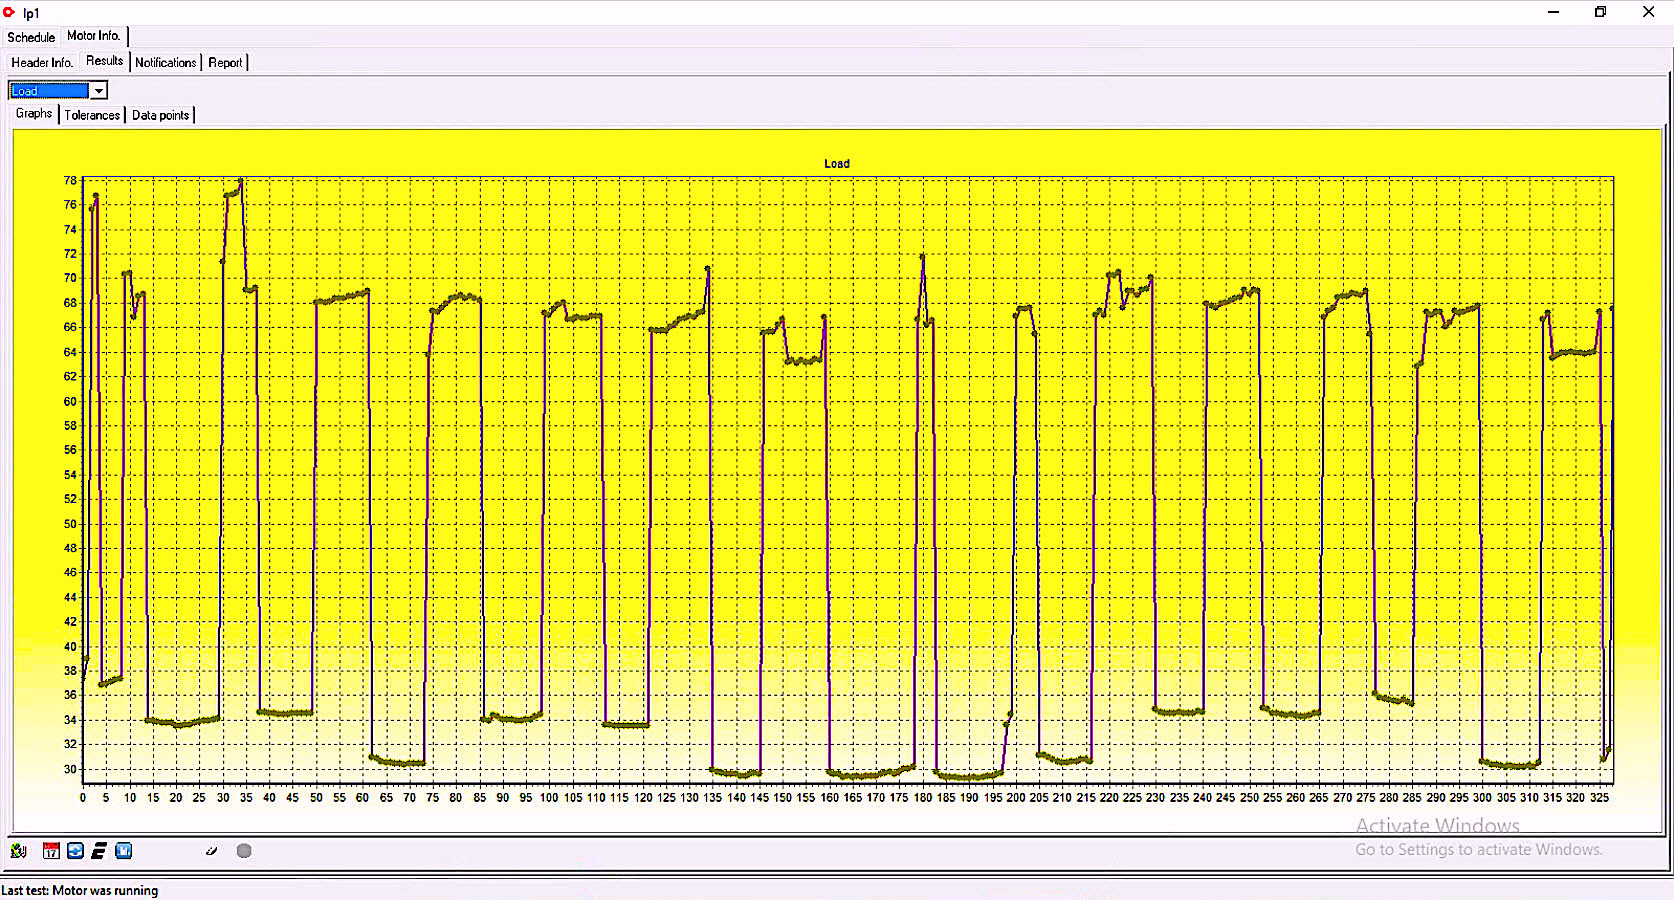
Fig. 7. Load profile in % of full load as set in the software header.
The loose Phase 3 connection shows during peak loads only.
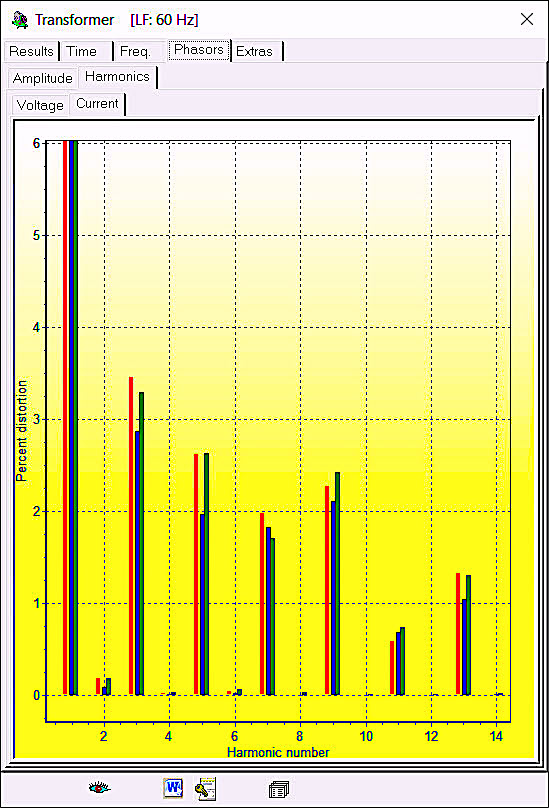
Fig. 8. Harmonic content: Phase 1 blue; Phase 2 red; Phase 3 green.
An infrared analysis was performed with a FLIR 100 imager on the lighting panel to identify if, in fact, a loose connection did exist. Figure 9 shows that one was detected at the top of a lug. After it was tightened, there was a slight improvement in the unbalance condition.
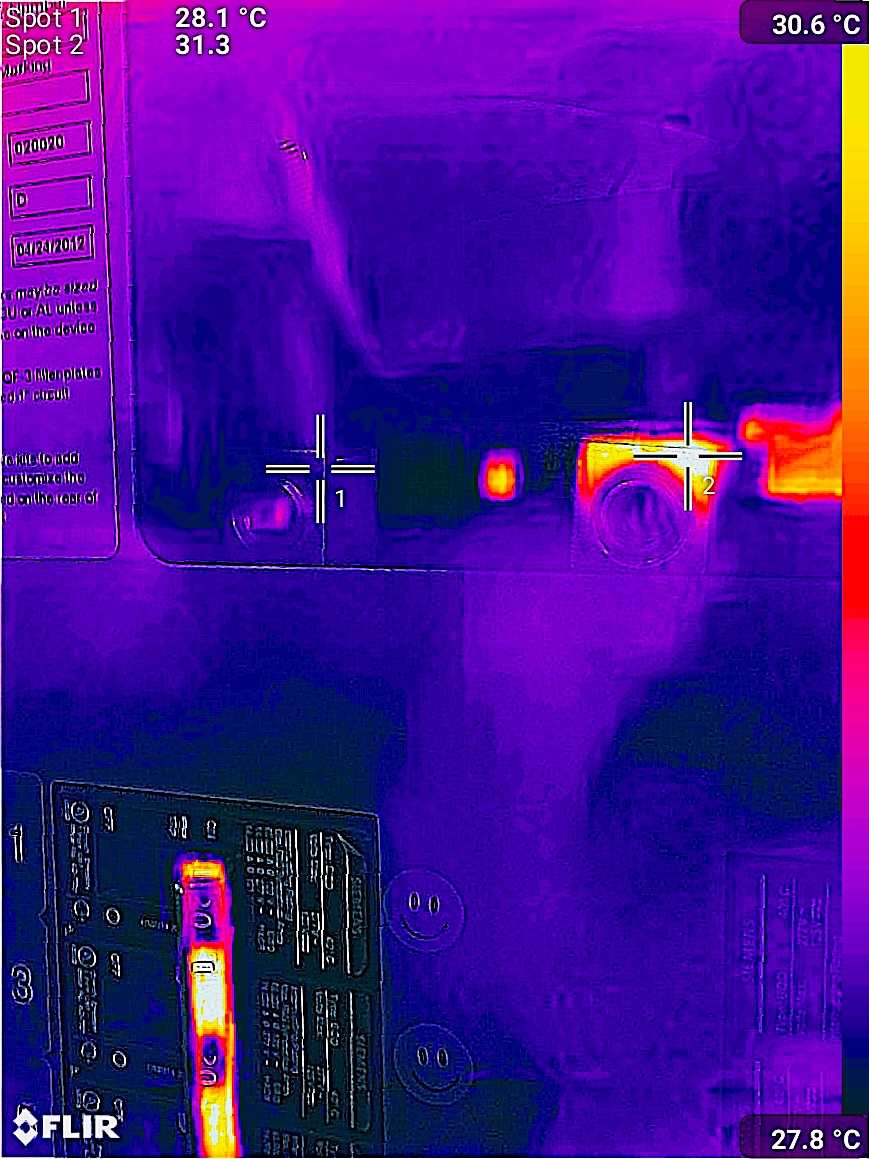
Fig. 9. A 3C hotspot found at the top of one lug. When the lug was tightened,
unbalance dropped to 1C under full lighting load.
The disconnect for the lighting panel was tested and found to be in excellent health. The lighting panel is fed directly from a set of three pole-mount transformers, so the feeders were traced back. Although they originally were thought to be located directly behind the facility, the trace showed otherwise: The actual transformers (two designs, three different phases) were almost a block away (see Fig. 10). In this thermal image, the transformer on the left is Phase 3; the center one is Phase 2; and the one on the right is Phase 1. Until additional information is forthcoming from the utility, it can be assumed these seemingly mismatched transformers reflect different impedances.
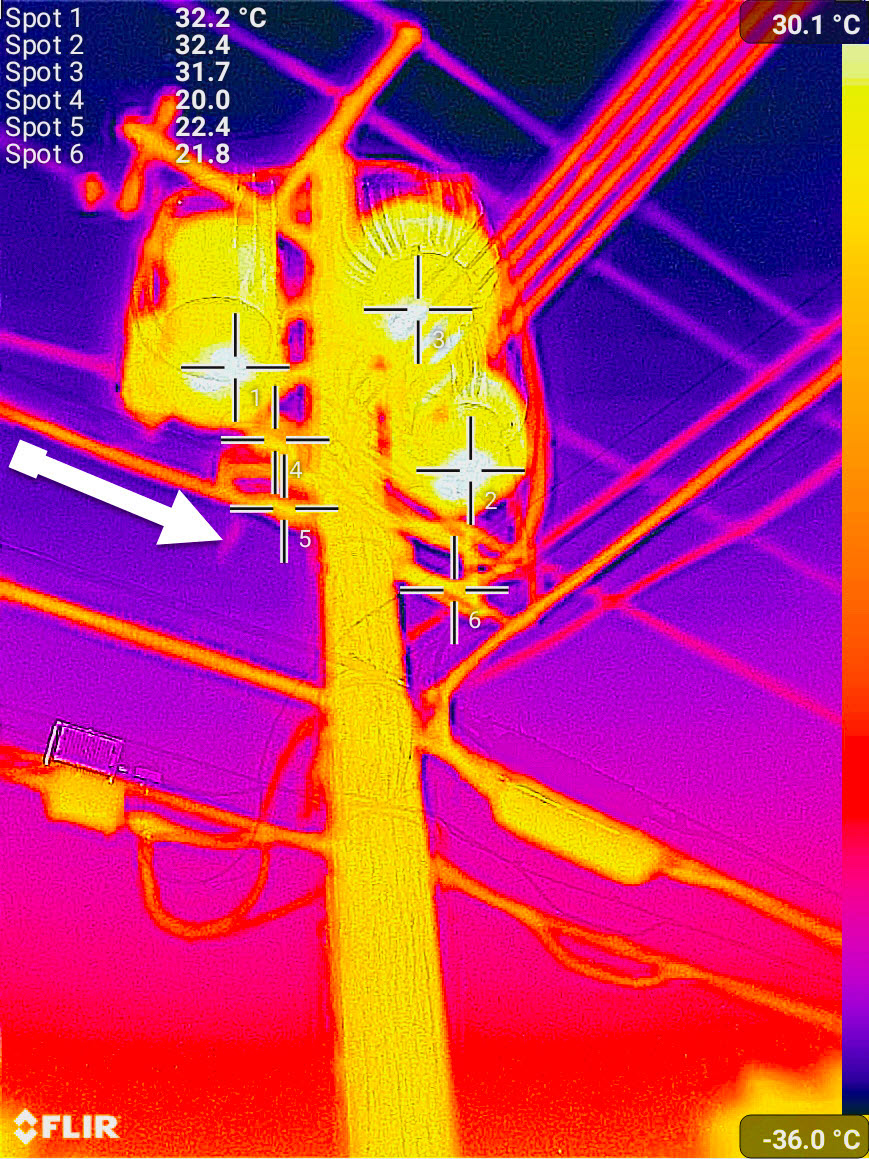
Fig. 10. Arrow is below and parallel to feeder toward the mismatched pole-mount transformers:
Phase 3 (left); Phase 2 (center); Phase 1 (right).
In the next article (Part 2), we will discuss concepts and capabilities regarding the use of ESA as a tool to analyze common issues in dry and oil-filled transformers of all types. These concepts and capabilities would be similar those using vibration analysis and several other technologies, including motion amplification, on transformer structures and tanks.TRR
ABOUT THE AUTHOR
Howard Penrose, Ph.D., CMRP, is Founder and President of Motor Doc LLC, Lombard, IL and, among other things, a Past Chair of the Society for Reliability and Maintenance Professionals, Atlanta (smrp.org). Email him at howard@motordoc.com, or info@motordoc.com, and/or visit motordoc.com.
Tags: reliability, availability, maintenance, RAM, electrical systems, transformers, electric motors, generators, Electrical Signature Analysis, ESA, Motor Signature Current Analysis, MCSA, predictive maintenance, preventive maintenance, vibration analysis, motor amplification

