
Here, and for the next six weeks in The RAM Review, I’ll be focusing on leading metrics that help drive proactive behaviors on the plant floor, increase MTBF/MTTF, decrease MTTR, and reduce the variability of those averages. Keep in mind, as I wrote in my May 15, 2021, article (see link below), that it’s dangerous to make decisions based on average values, such as Mean Time Between/To Failure (MTBF/MTTF), and Mean Time to Repair (MTTR), without having clear understanding about the variability of those averages and the nature of probability distribution. Moreover, those indicators are lagging, or rearview-mirror-type metrics. So, this week, as the title points out, I’m highlighting one of the most important leading indicators there is: “Overall Inspection Effectiveness (OIE).”
My approach to OIE, as well as the other leading metrics and key performance indicators (KPIs) that we’ll be addressing going forward, is to present them as a percentage value that is the product of three input percentages. OIE is is patterned after Overall Equipment Effectiveness (OEE), which was pioneered by Toyota and is the product of multiplying relative performance for Availability, Yield, and Quality. It’s an elegant approach that has proven to drive proactive behaviors in plants and facilities (Fig. 1).
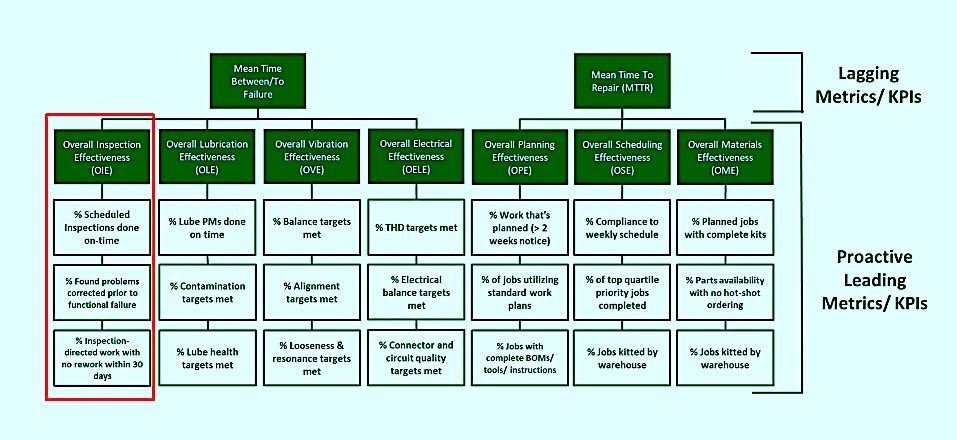
Fig. 1. Overall Inspection Effectiveness (OIE) is a leading indicator
that drives proactive behaviors, which, in turn, drive asset reliability.
WHAT OIE IS AND WHY IT’S IMPORTANT
OIE is calculated by multiplying the following three factors (Fig. 2):
1. Percentage of scheduled inspections that are completed on time, as scheduled.
2. Percentage of found problems that are corrected prior to functional failure of the asset. This includes
proactive tasks like lubrication, adjustment, etc,. as well as inspection/condition-directed corrective actions.
3. Percentage of inspection-condition-directed work that does not require rework inside of 30 days after
executing the proactive or corrective work.
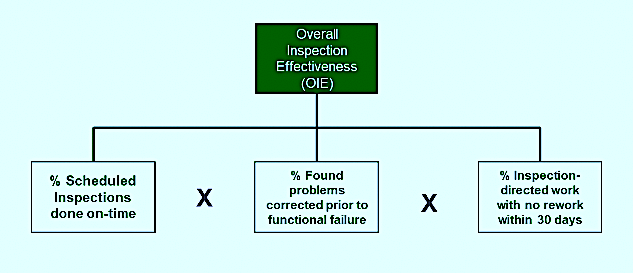
Fig. 2. The simple formula for OIE is the product of multiplying
the ‘behavioral inventories’ for the three input factors.
Think of each of these three components/metrics as an inventory process. We’re simply adding up the complying events and dividing by the total. For example, if the plant scheduled 54 inspections last week, and 48 of them were completed by the end of the week, the plant was 89% effective for that factor. If the plant is 95% effective at correcting found problems and opportunities and 97% effective in terms of work quality, the OIE for the week is 82%. The assumption is that if OIE increases because we’re behaving proactively and with precision, MBTBF/MTTF should be increasing; MTTR should be decreasing; and variability should decrease for both lagging metrics. That means our reliability is improving! Let’s take a closer look at each of the components of OIE.
1. Inspections Completed on Time
Whether inspections are visual/sensory-based, gage-based, or instrument-based, they must be completed on time to drive a high percentage of inspection or condition-directed maintenance work. Inspections drive proactive and corrective work notifications, the initiation point in the ‘Inspect to Work’ sequential work management process (inspect, notify, approve, prioritize, plan, schedule and execute). Percent of inspection compliance is calculated by merely dividing the number of inspections during the week that they are due by the total number scheduled for that week and multiplying by 100.
Inspection frequency determines the denominator for the equation and optimizing the inspection interval is a critical first step, given the fact OIE is a relative number: We can increase it by either increasing the numerator or decreasing the denominator. Simply decreasing the denominator, though, is the KPI equivalent of “cooking the books” (it’s cheating). I’ve always been a fan of the “golden ratio for maintenance inspections” pioneered by John Day, P.E., at Alumax South Carolina (now ALCOA). Day’s approach isn’t complicated: Over time, six inspections should increase one notification. If you’re finding an issue every third inspection, you’re under inspecting. If you’re writing a notification every 12th inspection, you’re over-inspecting. Strive to achieve a and maintain a 6:1 ratio over time.
2. Correction Prior to Functional Failure
Clearly, the objective for inspection/condition-directed maintenance is to avoid functional failure. If the Inspect to Execute process is effective, a proactive or corrective opportunity is found and addressed before a functional failure can affect production availability, yield, or quality. If, though, a found problem still results in a functional failure, the process is not working. We’re probably never going to be 100% at executing on found problems and opportunities. What we want is a relatively low miss-rate. Problems might include one or more of the following:
♦ The inspection isn’t far enough up on the P-F curve. It may be necessary to find an alternative technology
that has greater sensitivity or an enhanced signal to noise ratio.
♦ The inspection process failed to effectively assess the criticality and/or urgency of the found problem.
♦ The notification gatekeeping/approval process failed to assign the correct urgency and priority for
planning and scheduling.
♦ The maintenance planning and scheduling is inadequately resourced in terms of quantities and qualities
of people. (Hint: Analysis of your the backlog can be quite revealing here.)
3. No Rework on Inspection-Directed Work
We want to ensure that maintenance work is executed effectively. We want to avoid the scenario of having to service a machine, again, within a short period of time, because of poor execution and work quality. There’s no 100% accurate way to judge work as rework or as bona fide new work. We need to take a Pi = 5.0 (not 3.14. . .) approach here. I usually draw the line at 30 days. If we’re required to service a machine within 30 days of completing work, I tag it as rework. You may want to make your number 15 days or 60 days, depending upon the nature of your production process and its supporting assets.
You might ask why this metric is included in the OIE process. That’s a good question. I included it because a part of the inspection process is to accurately reflect the condition of the asset and what service is required in the work notification to request the work. A poorly defined scope of work in the notification leads to an increased error rate in the approval, prioritization, planning, scheduling, and execution stages of the Inspect to Execute process. This component provides the feedback loop that connects OIE to the overall maintenance-work-management process.
IN CONCLUSION
Lagging metrics are important because they reveal where we have been. Leading metrics drive behaviors that determine where we are going. Relying solely on lagging metrics is analogous to driving your vehicle looking only at the rearview mirror. Proactive metrics drive proactive behaviors in plants and facilities and lead the way to improved reliability. Inspections and Overall Inspection Effectiveness (OIE) drive all inspection/condition-directed maintenance. Measuring inspection performance is essential for the effective management of maintenance work.
Next, we’ll tackle Overall Lubrication Effectiveness (OLE).TRR
ABOUT THE AUTHOR
Drew Troyer has over 30 years of experience in the RAM arena. Currently a Principal with T.A. Cook Consultants, he was a Co-founder and former CEO of Noria Corporation. A trusted advisor to a global blue chip client base, this industry veteran has authored or co-authored more than 300 books, chapters, course books, articles, and technical papers and is popular keynote and technical speaker at conferences around the world. Drew is a Certified Reliability Engineer (CRE), Certified Maintenance & Reliability Professional (CMRP), holds B.S. and M.B.A. degrees. Drew, who also earned a Master’s degree in Environmental Sustainability from Harvard University, is very passionate about sustainable manufacturing. Contact him at 512-800-6031, or email dtroyer@theramreview.com.
Tags: reliability, availability, maintenance, RAM, metrics, key performance indicators, KPIs

