
Building on my recent series of articles about Overall Inspection Effectiveness (OIE), Overall Lubrication Effectiveness (OLE), and Overall Vibration Effectiveness (OVE), I’m turning my attention to Overall Electrical Effectiveness (OELE) this week. Like those previously discussed leading metrics, OELE can drive proactive, reliability-associated behaviors in plants and facilities. And, like those other metrics, it can be modified to suit specific applications.
As shown in Fig. 1, OELE is intended to drive behaviors that ensure the electrical pathways for plant equipment are balanced, aligned, and unrestricted. Similar to other proactive metrics featured in this series, OELE is the product of an inventory count to determine the percentage of machines that are free from common electrical faults, which can compromise the operational reliability of typical plant equipment. Overall Electrical Effectiveness drives up Mean-Time-Between/To-Failure (MTBF/MTTF), which is our goal.
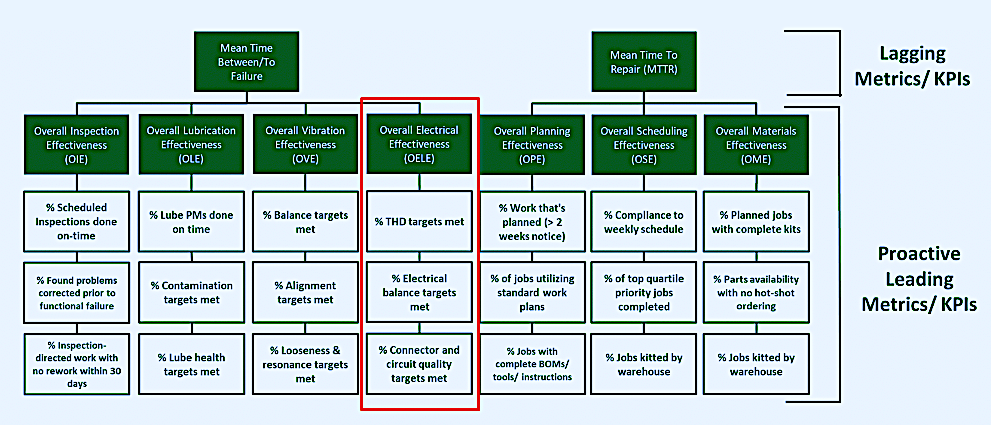
Fig. 1. Overall Electrical Effectiveness (OELE) is a leading indicator
that drives proactive behaviors, which, in turn drive asset reliability.
WHAT OELE IS AND WHY IT’S IMPORTANT
Electric motors, in their various forms, are the prime movers for most industrial plants. Their reliable and efficient operation is essential to a plant’s operational reliability and profitability. As touched on above, the purpose of monitoring OELE is to ensure that our electrical pathways are aligned, balanced across the three phases, and free from excessive resistance/impedance or stray electrical activity.
OELE is calculated as the product of multiplying the following three factors (Fig. 2):
1. Percentage of machines where Total-Harmonic-Distortion Targets (THD) are met.
2. Percentage of machines that are electrically balanced for voltage, current, resistance,
and inductance across the three phases.
3. Percentage of machines free from electrical-connector faults, which introduce excessive
resistance/impedance, arcing or flashover, tracking, or coronas that cause partial discharge.
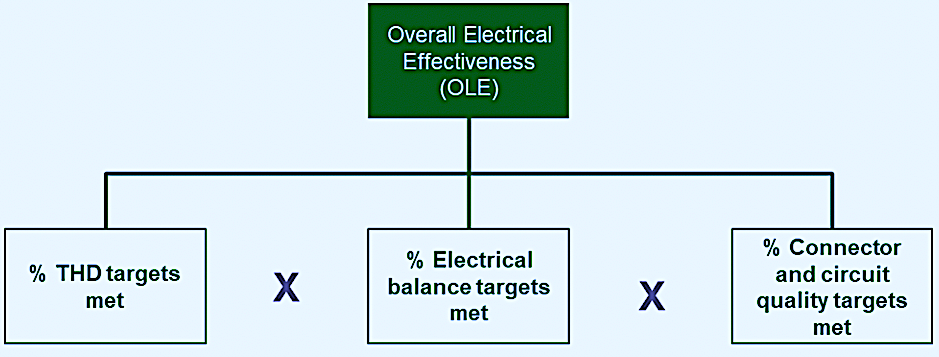
Fig. 2. The simple formula for OELE is the product of multiplying
the “behavioral inventories” for the three input factors.
Like the previously discussed leading metrics (OIE, OLE, and OVE), we need to consider each of the three OELE components/metrics as an inventory process. We’re simply adding up the complying events and dividing by the total.
1. Percentage of Total-Harmonic-Distortion Targets Met
Harmonic distortion occurs when the electrical supply contains harmonics of the line frequency, which is either 50 Hz or 60 Hz depending upon your location. In other words, if the line voltage is 460V at 60 Hz frequency, distortion occurs if there exists measure voltage at 120 Hz, 180 Hz, 240 Hz, or any other multiple of the line frequency. Figure 3 is a highly animated example of a measured voltage of 120V at 180 Hz, the third harmonic. This amount of distortion would not be observed in the plant, it is for illustrative purposes only.
As you can see from the illustration, the third harmonic is out of phase with the line frequency. It distorts the sinusoid and reduces available voltage to power the motor and increases the required current. This produces resistive (I2R) losses and generates a lot of heat, which acerates deterioration of winding insulation and other components.
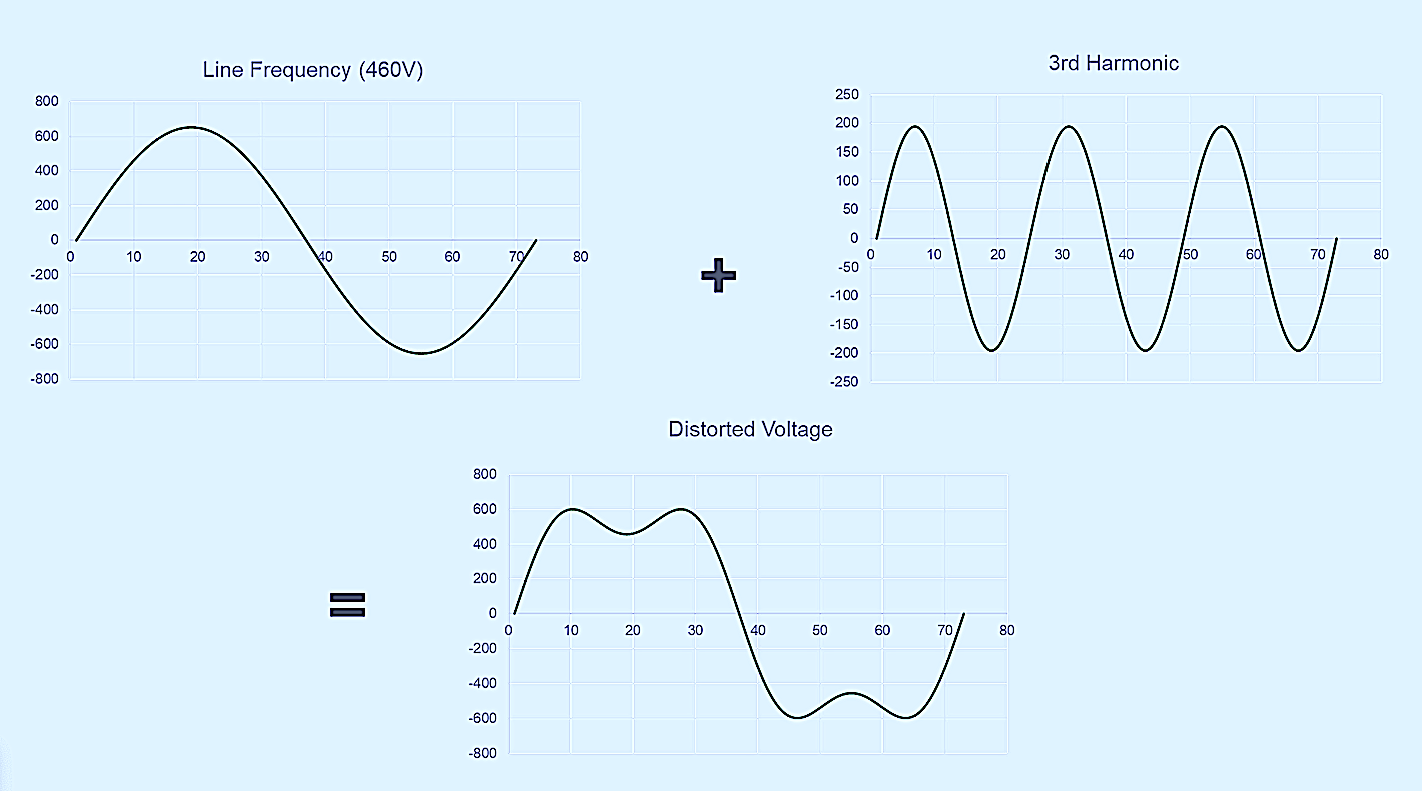
Fig. 3. As shown, In a line voltage of 460VAC and a frequency of 60 Hz, a harmonic is observed
with 120VAC at 180 Hz (the third harmonic). This amount of distortion would not be
observed in a plant. it is used here for illustrative purposes only.
Harmonic distortion is expressed as a percentage and for any given harmonic is calculated by dividing the voltage of the harmonic by the voltage at line frequency and then multiplying by 100. For total harmonic distortion, simply square the voltage for each harmonic, sum them and divide the square root of the sum by the line frequency voltage and multiply by 100. IEEE 519 calls for specific limits depending upon voltage. For example, motors between 1kv and 69kv should have less than 5% (less is better).
Harmonic distortion can originate from the power supply, be created in the plant, or a combination of both. For a far more detailed discussion about harmonic distortion, please refer to the following linked article, “Understanding Harmonics,” by my friend and fellow contributor to The RAM Review, Howard Penrose, PhD, CMRP (a.k.a.”Motor Doc”). Howard has forgotten more about harmonic distortion than I’ll ever know. In this article, he addresses current harmonics and suggests some strategies for addressing harmonic problems.
Click Here To Read The Referenced Article
“Understanding Harmonics”
2. Percentage of Electrical-Balance Targets Met
Electric motors must be balanced on voltage, current, resistance/impedance and inductance. across the three phases. Let’s start with voltage imbalance. First, calculate the average voltage for all three phases. Then, find the maximum deviation and divide the deviation by the average and multiply by 100 to get the voltage imbalance percentage. Any voltage imbalance of more than 2% percent is cause for concern. That’s because it generates heat—lots of heat—since the voltage deficit must be offset by increasing current, which produces I2R losses and electrical heating. For example, a 3% voltage imbalance will increase temperatures by about 20%. A 5% voltage imbalance results in a whopping 60% increase in temperature. So, a motor that typically runs at 65 C (149 F) could heat up to 104 C (219 F). And the life of winding insulation would be cut in half for every 10 C (18 F) increase in temperature.
Furthermore, voltage imbalance produces a derate of an electric motor. That means the unit can’t produce the nameplate power. For example, if the nameplate on an electric motor is 100 kW (134 hp), a 5% voltage imbalance would reduce the power capacity to 75 kW (101 hp). If you were placing an 80% load on a motor, you would be operating above its derate-adjusted capability.
Voltage imbalance produces a current imbalance. As a rule of thumb, the current imbalance will be about seven times the voltage imbalance—if the voltage imbalance is the cause for the current imbalance. (But that can vary.) In addition, resistive/impedance imbalance can create a current imbalance. It’s possible to experience a voltage imbalance and a resistive/impedance imbalance that both contribute to a current imbalance. Thus, it makes sense to measure and trend the three conditions.
I again refer you to Howard (Motor Doc), who has authored some great articles for The RAM Review on electrical balance, including the following:
Click Here To Read “The Impact of Voltage Unbalance On Induction Electric Motors“
Click Here To Read “Understanding Voltage Variations & Electric Motors“
Click Here To Read “Regarding Reliability of Electric Motors: Testing With Ohm Meters”
And, while you’re thinking about power quality, including inrush, check out the following two articles from Howard:
Click Here To Read “The Mysterious Power Factor”
Click Here To Read “Power-Quality Basics: Voltage Drop During Inrush”
Another element of electrical balance is phase-to-phase inductance. Inductance balance refers to the efficiency with which the electric motor converts electrical energy into mechanical rotating energy turning the motor’s shaft. In an asynchronous electric motor, electrical energy is sent to the windings in three phases separated by 120 degrees. The windings are conductive (copper) but separated by insulation. Running current through the stator’s windings creates a magnetic field that induces rotation of the shaft. If winding quality is poor, the efficiency with which the three phases convert electrical energy into mechanical energy will vary. According to David McKinnon of PDMA, there are no well-defined limits for inductive imbalance, but he suggests no more than 7% for form-wound motors and no more than 12% for loose-wound motors – less is best.
3. Percentage of Electrical-Connector and Circuit-Quality Targets Met
It’s reasonable to say that half of our electrical problems are associated with fastener and connector issues. (In some industries, the percentage is even higher.) These fastener and connector problems include cables to connectors, connectors to terminals, bus bars, fuses and fuse clips, Motor Control Centers (MCCs), bus ducts, and more, i.e., basically any connection point along the electric pathway. Common problems include, among other things, undersized connections, poorly crimped connections, dirt, grease, or oil contamination, carbonized conductors, and corroded connections (including galvanic corrosion caused by incompatible metals).
We employ infrared thermography (IR) and motor-circuit analysis (MCA) to determine our inventory of complying and noncomplying electrical connections and circuits. I would extend this inventory to include monitoring for arcing/flashover, electrical tracking, and corona/partial discharge as well. I would also include the dielectric performance of transformer oil, which serves as the insulating medium.
IN CONCLUSION
The reliability of electromechanical equipment in the plant requires high-quality power distributed with balanced voltage across circuits that introduce a minimal and balanced resistance/impedance that are properly sized and well connected. The OELE metric can help ensure those requirements are being met.
This installment concludes our focus on proactive leading indicators increase MTBF/MTTF. In my next article, we’ll move on to metrics that decrease mean time to repair (MTTR), starting with Overall Planning Effectiveness (OPE).TRR
REFERENCES
McKinnon, D. (Date Unknown), “Using a Six Fault Zone Approach for Predictive Maintenance on Motors,” PDMA Corp.
www.pdma.com/pdfs/Articles/Using_a_Six_Fault_Zone_Approach_for_Predictive_Maintenance_on_Motors.pdf.
(Accessed 26 June 2021.)
ABOUT THE AUTHOR
Drew Troyer has over 30 years of experience in the RAM arena. Currently a Principal with T.A. Cook Consultants, he was a Co-founder and former CEO of Noria Corporation. A trusted advisor to a global blue chip client base, this industry veteran has authored or co-authored more than 300 books, chapters, course books, articles, and technical papers and is popular keynote and technical speaker at conferences around the world. Drew is a Certified Reliability Engineer (CRE), Certified Maintenance & Reliability Professional (CMRP), holds B.S. and M.B.A. degrees. Drew, who also earned a Master’s degree in Environmental Sustainability from Harvard University, is very passionate about sustainable manufacturing. Contact him at 512-800-6031, or email dtroyer@theramreview.com.
Tags: reliability, availability, maintenance, RAM, metrics, key performance indicators, KPIs, motors, electrical equipment, electrical systems, fasteners, connectors, harmonics, voltage, current, resistance/impedence, inductive imbalance

