
Part 1 of this article (April 10, 2022, see link below) covers strategic aspects in upgrading of Enterprise Asset Management (EAM) or Enterprise Resource Planning (ERP) systems. Often, the configurations of these Management Information Systems (MISs) are driven by Information Technology (IT) teams without adequate involvement of the teams that actually depend on the information from these systems to support important decisions. Those decisions ultimately determine an organizations’ ability to create value in the form of profit, safety, and environmental performance.
Click Here To Read Part 1 Of This Article: “The Strategy”
If an EAM/ERP system configuration is not Business Process Centered (BPC), plant teams must find “sneaker nets” using spreadsheets and other ways to work around the system. For example, while working with one of my clients, we issued a request to track some leading Key Performance Indicators (KPIs) to drive proactive behaviors in the plant. The EAM/ERP administrator really tried to help, but in the end admitted, “We can’t get there from here.” The EAM/ERP simply could not be configured to provide the KPIs required to drive the desired business improvement.
Here in Part 2, we’re diving into the how-to details of executing a Business-Process-Centered EAM/ERP integration. This integration is foundational (and crucial) in optimizing business processes in a plant and defining the metrics and KPIs to support those processes and the decisions that enable them.
A 12 STEP PROCESS FOR BPC EAM/ERP CONFIGURATION
Figure 1 lays out this process, which we’ll go through step-by-step. Each step is numbered to make it easy to follow along.
(Note: Figure 1 is, obviously, quite detailed. if you wish to receive an A3 or 11”X 17”-sized PDF of this graphic, please email me directly at dtroyer@theramreview.com, and specify the desired document size.)
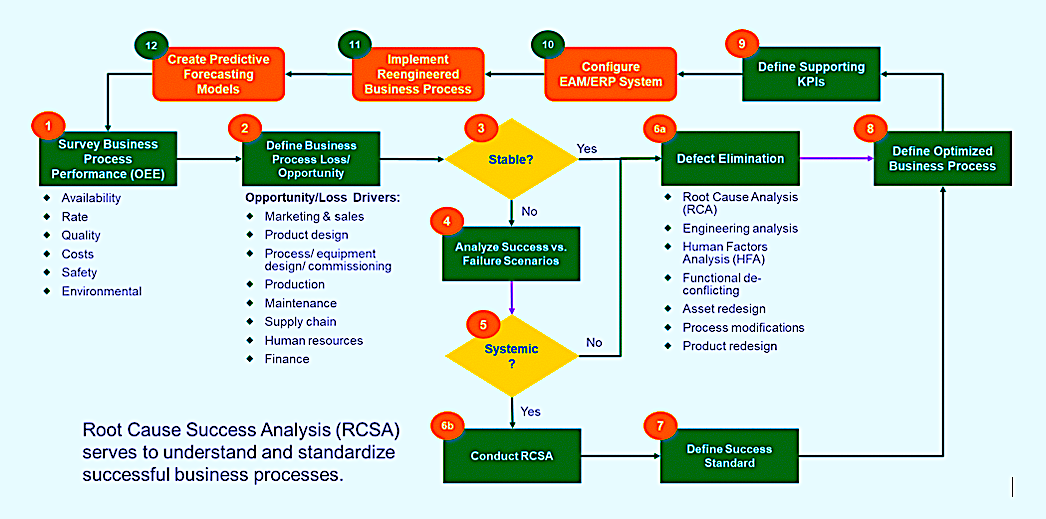
Fig. 1. A 12-step process for Business Process-Centered EAM/ERP configuration.
1. Survey Business Process Performance. Overall Equipment Effectiveness (OEE) analysis is the starting point for the process, The reason is that if OEE is created and monitored accurately, a 100% OEE score equals operational perfection whereby the plant, factory or mine operates 8,760 hours per year at 100% of the plants highest sustainable rate of production with 100% quality compliance. It’s important to note that achieving a 100% OEE does not represent the organizations “North Star.” We seek to optimize OEE so as to maximize profits and minimize safety and environmental impacts. However, in the interest of continuous improvement, we seek to increase the OEE number that maximizes value on our True North objectives. For example, if the plant requires 1,500 hours of planned maintenance to maximize profit, then Availability is optimized at just under 83%. However, if we could reduce that scheduled downtime to 1,000 hours per year, we could increase OEE to over 88% and increase our productive throughput by more than 6%. The impact on contribution margin would be even greater.
2. Define Business Process Losses/Opportunities. Next, we want to analyze OEE losses and any associated safety and environmental risks. Some of these losses may be induced by market/marketing issues. In other cases, we may have production-induced losses. And in still others, losses may by equipment induced. As an example, if an organization can’t sell everything it makes, OEE is reduced because plant Availability and/or Rate/Speed are reduced. However, there are no operational and/or maintenance actions that can be taken on the equipment in the plant to address this market-induced losses. In other instances, the sales and marketing teams commit to customer demands that exceed the capabilities of the plant and its equipment assets. Production-induced losses include poor product or process changeover effectiveness or efficiency, running the equipment beyond its sustainable rate of production. Equipment-induced losses include poor shutdown/turnaround/outage (STO) planning and execution, excessive unplanned downtime, excessive planned maintenance, and the like.
(Note: The topic of analyzing and mitigating Market/Marketing-, Production-, and Equipment-induced OEE losses was explored through a 12-article series in The RAM Review [see link below].)
Click Here To Access The Referenced Articles
On Analyzing And Mitigating OEE Losses
3. Evaluate the Stability of the Loss/Opportunity. This is a question and decision point. If an identified loss/opportunity is stable, which means it’s predictably problematic, proceed to Step 6a, which is described below. However, we often encounter unpredictability whereby the manufacturing process is effective part of the time and ineffective part of the time. If this is the case, then proceed to Step 4 below.
4. Analyze Success vs. Failure Scenarios. When we encounter inconsistency in the effectiveness or ineffectiveness of an equipment dependent business process, we want to dig deeper into that process to determine if there is a system underlying forcing function. As an example, consider this example from a project with a pulp and paper company. On a paper machine, tears in the paper can occur from time to time. They’re called “paper breaks.” In evaluating break recovery time statistically, we discovered huge differences from event to event. As it turned out, some teams recovered from breaks more quickly than other teams. The more efficient teams were also more effective in terms of the likelihood that the recovery would work without encountering another paper break.
5. Is the Difference between Successful and Failure Scenarios Systemic? In my paper-break-recovery example, we found that there was a systemic difference between successful and unsuccessful break-recovery scenarios. Different teams recovered from paper breaks more effectively and efficiently than other teams. In those cases where analytics reveal that the differences are systemic, we proceed to step 6b (below). If we don’t find evidence of systemic differences, we default to 6a where this work stream joins with the output of Step 3 above.
6. Defect Elimination. Once losses have been identified and the preliminary analysis has been completed, it’s necessary to analyze loss modes to understand the mechanisms and underlying root causes that produce them. The analysis may be at the process level, the product-level (the product that we’re producing), or at the asset or equipment level.
(a) Defect Elimination. Defect elimination is a process that employs a range of analytical techniques with which to understand the mechanisms and causes that lead to adverse or undesirable results. These processes include:
-
-
-
- Root Cause Analysis (RCA). Including Root Cause Failure Analysis (RCFA) and Root Cause Success Analysis (RCSA), which is described in 6b.
- Engineering Analysis. Finite Element Analysis (FEA) Computation Fluid Dynamics (CFD), etc.
- Human Factors Analysis. Empirical evidence suggest that Human Factors represent contribute about 80% of all adverse events. These include organizational weaknesses (e.g., lack of or ineffective procedures, inadequate training, insufficient oversight, etc.) and individual weaknesses, such as inattention to detail.
- Functional Deconflicting. It’s not uncommon for different functional groups to unintentionally undermine other functional groups, which can compromise overall asset performance.
- Asset Redesign. The design of the asset represents its genetic code, or DNA. Sometimes it’s necessary to modify that design to improve it’s reliability, operability, maintainability, capability, sustainability, etc.
- Process Modifications. In a situation where the process itself is resulting in OEE losses, it must be redesigned. For example, if running a machine or process beyond its design limits, it may be necessary to modify the process to avoid this scenario. Or, if changeover time is excessive, we employ Lean practices such as Single-minute-exchange-die (SMED) to create a pitstop mentality, etc.
- Product Redesign. In some instance, the organization commits to deliver products that are simply beyond the manufacturing capability of the equipment. In those instances, the product must be redesigned if it doesn’t make sense to modify the process or the equipment assets.
-
-
(b) Root Cause Success Analysis (RCSA). When we observe a systemic difference between successful scenarios and unsuccessful scenarios, we employ the RCSA variation of RCA. The difference is simple. With RCFA, we seek to understand the underlying root causes that produce an undesirable outcome. With RCSA, we seek to understand the underlying root causes that lead to desirable and successful outcomes. It’s particularly effective when we can conduct a comparative analysis between successful and unsuccessful scenarios.
7. Define Success Standards. The outcome of item 6b is to standardize business processes that produce successful outcomes. In the scenario described in item 4 above (where we analyzed short versus long paper-break-recovery times), some production teams had figured out how to recover from paper breaks very efficiently and effectively. So, we conducted RCSA, documented the actions of the successful teams, improved upon their process with SMED principles, and then trained all the teams on the newly standardized successful process. That process uncovered a great deal of “hidden plant”–production that was lost to ineffective break-recovery practices.
8. Define Optimized Business Process. For each business process that is analyzed, improved, and optimized, we define the new process. This may include, among other things: required modifications to the equipment, process, or manufactured production; instructions and procedures, including fit, tolerance, quantity, and quality details, required sequence, visual plant elements (g., sensory indicators); necessary prework; tool and material requirements, where applicable, etc. It’s also necessary to develop rollout plans for newly defined and optimized business processes. It’s important to note that any business process modifications must be economically cost-justified.
9. Define Supporting Metrics and KPIs. At this point, we’re in a position to define the KPIs necessary to monitor performance and support decisions associated with those processes. An MIS system is, after all, a management information system. It’s a system that provides information to managers that they require to make effective decisions to create value for the organization. Exemplary KPIs for asset management, Production & Lean Operations, Supply Chain, Sustainable Manufacturing, and Safety & Health are described in Fig. 2. These are just examples. It’s imperative that the KPIs be developed in concert and in alignment with the business processes, and associated decisions that they support. It’s also important to note that we require a balance of leading and lagging KPIs. Lagging KPIs keep score about how we’ve done. We look in the rear-view mirror with lagging KPIs. Conversely, Lagging KPIs drive behaviors that enable proactive control. Ultimately, these metrics must support effective decisions that drive Return on Net Assets (RONA), Economic Value Added (EVA), and Environmental, Social and Governance (ESG), which represent “True North” for most organizations.
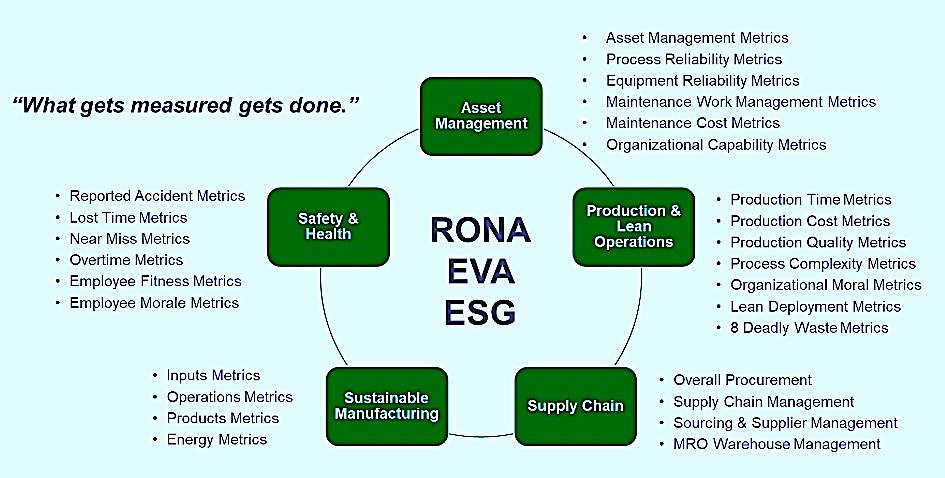
Fig. 2. Exemplary example of KPIs centered around the driving
of an organization’s RONA, EVA and ESG objectives.
Item 10 in Fig. 1 addresses the specifics of configuring an EAM or ERP system after business losses have been analyzed and reengineered, where required, and the KPIs required to support them have been defined. Item 11 addresses implementation of the Reengineered and Optimized business processes. And Item 12 addresses the creation of predictive forecasting models, machine learning, etc,. to enhance our understanding of asset and process performance. We’ll tackle those three items in my next article for The RAM Review.
CONCLUSION
An EAM/ERP system upgrade is an opportunity to strip down to a clean core and ensure that the system supports achievement of the firms “North Star” goals. This article provides step-by-step instructions for employing Overall Equipment Effectiveness (OEE) as a tool for identifying, analyzing, and mitigating losses in the business through an optimized business process. A byproduct of the process is the definition of the Key Performance Indicators (KPIs) required to enable effective decisions. At this stage, the organization is prepared to configure its Enterprise Asset Management (EAM)/Enterprise Resource Planning (ERP) system so that it works for the people instead of the people working for the system.TRR
ABOUT THE AUTHOR
Drew Troyer has over 30 years of experience in the RAM arena. Currently a Principal with T.A. Cook Consultants, a Part of Accenture, he was a Co-founder and former CEO of Noria Corporation. A trusted advisor to a global blue chip client base, this industry veteran has authored or co-authored more than 300 books, chapters, course books, articles, and technical papers and is popular keynote and technical speaker at conferences around the world. Drew is a Certified Reliability Engineer (CRE), Certified Maintenance & Reliability Professional (CMRP), holds B.S. and M.B.A. degrees. Drew, who also earned a Master’s degree in Environmental Sustainability from Harvard University, is very passionate about sustainable manufacturing. Contact him at 512-800-6031, or email dtroyer@theramreview.com. The opinions expressed in Drew’s articles are his own, not those of his employer.
Tags: reliability, availability, maintenance, RAM, key performance Indicators, KPIs, Enterprise Asset Management, EAM, Enterprise Resource Planning, Management Information System, MIS, Computerized Maintenance Management System, CMMS, Overall Equipment Effectiveness, OEE

