
Continuing with our focus on metrics and Key Performance Indicators (KPIs), let’s carry on with our discussion of the balance sheet, i.e., the denominator in the Return on Net Assets (RONA) equation that has been addressed in previous installments of The RAM Review). In Part 1, in the Feb. 19, 2022, issue (see article link below), we discussed Replacement Asset Value (RAV). Here, we are looking at Inventory, the other major asset management-related balance sheet component.
Most industrial factories and plants carry two primary types of inventory: Production Inventory and Maintenance, Repair and Operations (MRO) Inventory (Fig. 1). Effective inventory management can dramatically impact the RONA performance of an organization and, some instances, even create cash-flow problems.
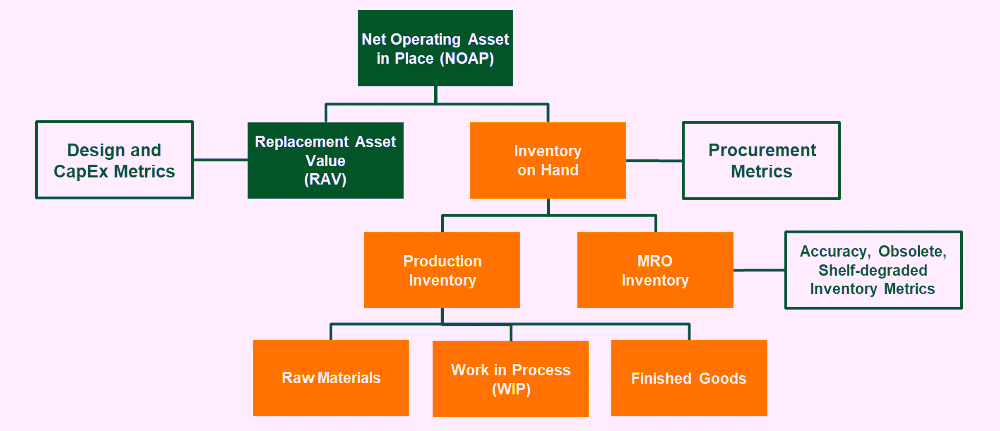
Fig. 1. Production inventory and MRO inventory, along with
Replacement Asset Value (RAV) make up the tangible balance
sheet elements for most industrial plants and factories.
PRODUCTION FOR INVENTORY
Much like redundant systems, which in the cited Feb. 19, 2022, article, inventory is a risk mitigation tool. But, as with redundancy, it’s an expensive option for reducing risk.
Production inventory is employed to ensure that production processes continue to flow uninterrupted and to ensure the organization is prepared to deliver on customer orders in a time fashion. MRO inventory is employed to ensure that equipment is maintained to ensure production Availability at the desired Production rate–which are two important elements of Overall Equipment Effectiveness (OEE). Production Inventory can be further sub-classified as Raw Materials, Work in Process (WIP) and Finished Goods.
♦ Raw Materials. We usually refer to raw materials as the metal, chemical, organic, or other materials for which value-adding processes are applied to create finished.
♦ Work In Process (WIP). WIP is the inventory staged between various sub-processes.
♦ Finished Goods. This inventory is products for which all production sub-processes are complete, and the inventory is ready to ship to or be collected by the customer.
Minimizing inventory on hand is a major focal point in Lean Manufacturing because it’s identified as one of the six, seven, or eight so-called “deadly” wastes (Table I). Inventory is a very effective way to mitigate production risks that could adversely affect production Availability and/or production Rate. Remember, though, that holding inventory is not free.
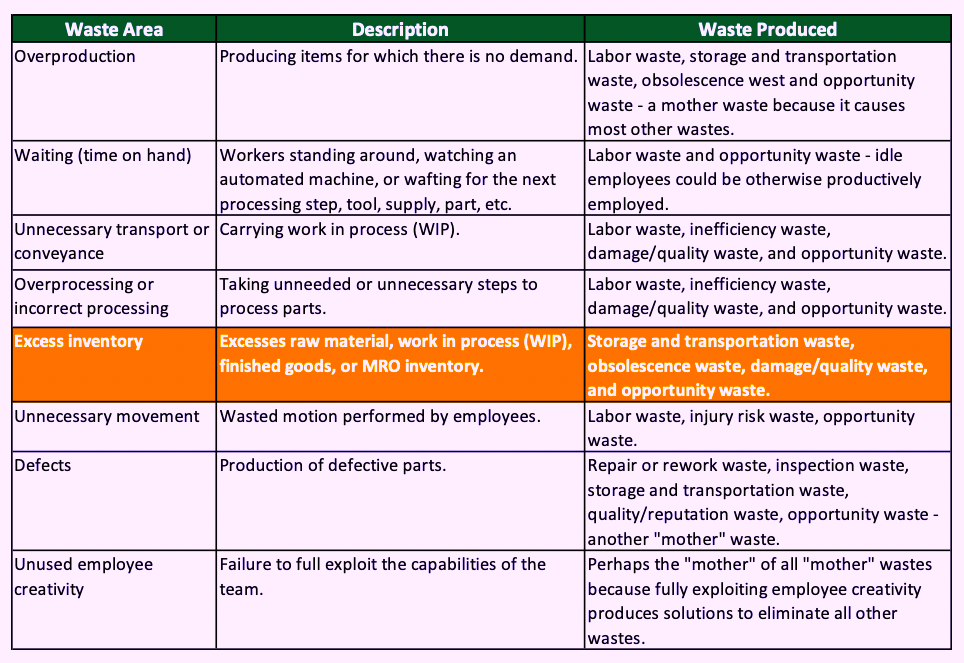
Table I. Excess Inventory Is Among The Eight “Deadly” Wastes
That Prevent Lean Manufacturing.
♦ Working Capital Cost. The rate of working capital varies as a function of economic condition and the creditworthiness of the company.
♦ Space and Systems. Inventory requires space, bins, shelves, computer systems, and other items to support its storage and management. This cost can be very high for extremely perishable inventory such as food products.
♦ People. People are required to manage inventory, count it, etc.
♦ Storage Degradation. Inventory is, to varying degrees, perishable. It is susceptible to spoilage, chemical degradation, mechanical degradation, etc.
♦ Obsolescence. In some instances, inventory is kept until a point in time when it’s no longer relevant to the product or the process.
♦ Risk-based Costs. These include insurance in the event the inventory is damaged or causes damage. If the inventory is potentially hazardous to people and/or the environment, risk-based costs can be quite high.
For example, if an organization keeps $1,000,000 in inventory on hand, the estimated profit impact equals about $220,000 per year. In some industries, the cost to hold excessive inventory can be much higher. Consider the automobile manufacturing industry, where overproducing can have drastic long-term effects. What if the market for automobiles slows, but a manufacturer continues to produce vehicles at a normal rate (a level to which bonuses might be tied)? At some point, the company either runs out of space to park the finished vehicles, the cash required to support continued operations, or both. Production must be halted or significantly slowed down.
If the automobile manufacturer runs out of cash, extreme measures must be taken to liquidate the excessive inventory. Usually, this involves deep price reductions, increased marketing costs, and high sales commissions or other sales incentives. Think about a vehicle that normally sells for $30,000 with a $12,000 manufacturing cost, $1,000-per-vehicle advertising/marketing cost, and $8,000 in incentives to the dealer and/or salesperson. In this scenario, the manufacturer turns a $12,000 gross profit per vehicle to cover fixed costs and deliver a profit (Table II).
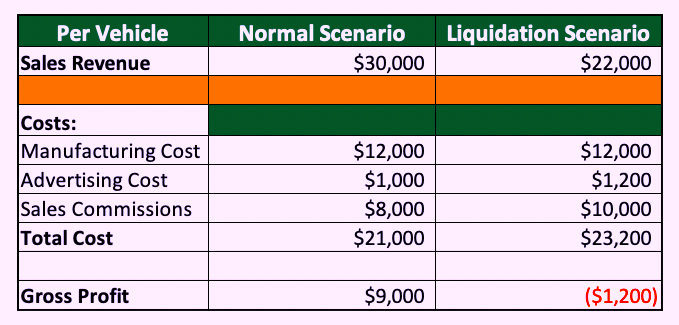 Table II. Example of An Automobile Manufacturing Scenario
Where Excessive Finished Good Inventory Forced
Some Tough Decisions to Resolve Cash-Flow Issues.
However, if the company gets into a cash-flow bind, it may be forced to reduce the price of the vehicles. The automobile market is generally elastic, meaning that as price falls, demand increases, and vice versa. The elasticity may vary for different vehicle types. In our scenario, the manufacturer was forced to reduce the selling price from $30,000 to $22,000. The manufacturing cost was held constant at $12,000. The advertising cost was increased by $200 per vehicle to $1,200. And dealer sales commissions were bumped up from $8,000 to $10,000 per vehicle. This results in a total per vehicle cost of $23,200 and a net loss of ($1,200).
Don’t overlook the longer-term “hangover” effect in this scenario. Consumers may now perceive the value of the vehicle to be $22,000 as opposed to the previous price of $30,000. It may take the manufacturer several years to recover from the psychological price-perception impact associated with the company’s forced inventory liquidation.
It’s ideal to adopt “just-in-time” (JIT), or near-JIT practices for managing raw materials, WIP and finished-goods inventory. The inventory arrives at the point which it is required, or very close to the exact time that it will be used. One of my former clients had an opportunity to analyze the throughput timing in a batch-and-queue manufacturing process. He concluded that each product required six seconds of processing spread over 47 days. Except for those six seconds, each product was in conveyance and inventory. When I worked with him, the time was reduced from 47 to 23 days and going lower. This had an enormous impact on the business.
MRO INVENTORY
The other major inventory category is MRO inventory, i.e., the parts and materials required to keep production assets up and running. MRO inventory falls into three general categories:
♦ Consumption Items. These materials are generally consumed at a rapid rate and have a generally high turnover rate. Examples include lubricants, nuts and bolts, etc. Bin level-type methods or economic order quantity (EOQ) order point models are typically employed to determine correct inventory levels.
♦ Maintenance Items. These items are used routinely, but not at the rate of consumption items. These might include pumps, bearings, electric motors etc. EOQ order point methods are typically employed for maintenance items. Standardization really pays off for the inventorying of maintenance items. For example, I have, on many occasions, seen plants that inventory the same electric motor from numerous suppliers because the systems they support were attached to different capital (CapEx) project. Standardization during the design phase of the CapEx project is a proactive way to reduce excessive inventory.
♦ Critical Spares. Perhaps the most difficult MRO inventory decisions relate to critical spares. Critical spares are kept on hand in the event something unexpected goes wrong. The criteria used in deciding if a critical spare should be kept include: 1) the impact of a failure in terms of magnitude and duration; 2) lead time for obtaining the parts and/or materials required to recover from a failure; 3) cost of the critical spare; and 4) inventory carrying costs; 5) the number of systems that a single critical spare can support. I typically employ an economic analysis process that produces an internal rate of return (IRR) to determine if a critical spare is indeed justified. Standardization pays off for critical spares too.
As I’ve noted in past articles, Maintenance Professionals are, by nature, risk averse, i.e., belt-and-suspenders-types of people. Left to their own devices, they’ll fatten up MRO inventory levels. So, we must monitor our inventory turnover ratio, which is simply the total value of the inventory used during the year divided by the average inventory value during the year per the following equation.
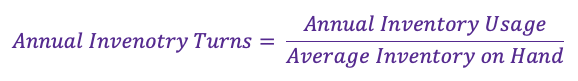
Consider this example of a plant that used $700,000 of inventory during the year and the average inventory value over that period was $1,000,000. Annual inventory turns would equal 0.7. This situation reflects a poor, but very common, inventory turn ratio. Still, I’ve seen much worse. performance.
Properly rationalized, your inventory turns ratio should exceed 2.0, and ideally reach 3.0 or higher. In addition to reducing inventory carrying costs, paring down your MRO inventory simplifies the providing of parts and materials that are necessary to support the maintenance of production assets.
CONCLUSIONS
Return on Net Assets (RONA), the most important measure of management effectiveness for a manufacturing, process, mining, or other equipment asset-intensive organization. RONA is simply income statement divided by the balance sheet. A lean balance sheet increases RONA. The arithmetic is very simple.
Reducing inventory is a great way to lean your balance sheet. A good rule of thumb is that inventory carrying costs equal 22% of the inventory value per year. These carrying costs directly impact your bottom line. Reducing Raw Materials, work in progress (WIP), and finished goods inventory is a major focus of Lean Manufacturing.For MRO inventory, aim for a turnover ratio of 2.0 to 3.0 times. Standardizing parts and materials will go a long way in helping you achieve that turnover goal.
Next week, we will be addressing Earnings Before Interest & Tax (EBIT) and Earnings Before Interest, Tax, Depreciation & Amortization (EBITDA).TRR
REFERENCE
Troyer, Drew (2000-2020). Plant Reliability in Dollars & $ense Coursebook. (Editor’s Note: This coursebook accompanies the author’s four-day workshop on the subject.)
ABOUT THE AUTHOR
Drew Troyer has over 30 years of experience in the RAM arena. Currently a Principal with T.A. Cook Consultants, a Part of Accenture, he was a Co-founder and former CEO of Noria Corporation. A trusted advisor to a global blue chip client base, this industry veteran has authored or co-authored more than 300 books, chapters, course books, articles, and technical papers and is popular keynote and technical speaker at conferences around the world. Drew is a Certified Reliability Engineer (CRE), Certified Maintenance & Reliability Professional (CMRP), holds B.S. and M.B.A. degrees. Drew, who also earned a Master’s degree in Environmental Sustainability from Harvard University, is very passionate about sustainable manufacturing. Contact him at 512-800-6031, or email dtroyer@theramreview.com. The opinions expressed in Drew’s articles are his own, not those of his employer.
Tags: reliability, availability, maintenance, RAM, key performance Indicators, KPIs, inventory management, Production Inventory, MRO Inventory, Replacement Asset Value, RAV, Return on Net Assets, RONA, Economic Value Added, EVA, Overall Equipment Effectiveness, OEE

