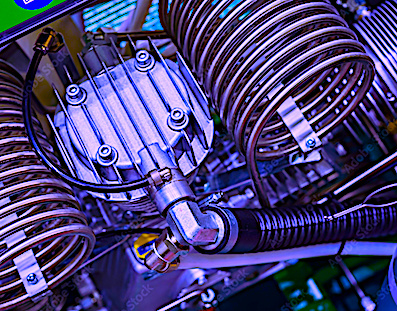
One of the more challenging systems to analyze with Electrical or Motor Current Signature Analysis (ESA or MCSA) is that of a synchronous motor running a reciprocating compressor. As the piston moves, there’s an impulse at both ends of the stroke, which will show at the running speed as a large peak. The case study in this article involves a 3,000-hp, 300-rpm, 585-Amp, 2,300-Vac synchronous motor connected directly to a reciprocating compressor. In our example, there’s a solid coupling. In other cases, there could be a direct shaft from the rotor to the crank shaft.
As shown in Fig. 1, the operation of the reciprocating compressor results in high 1X-rpm sidebands around line frequency with significant harmonics. This is also shown in Fig. 2, in the high frequency spectra. With all of this expected noise, can we view any conditions in the electric machine?
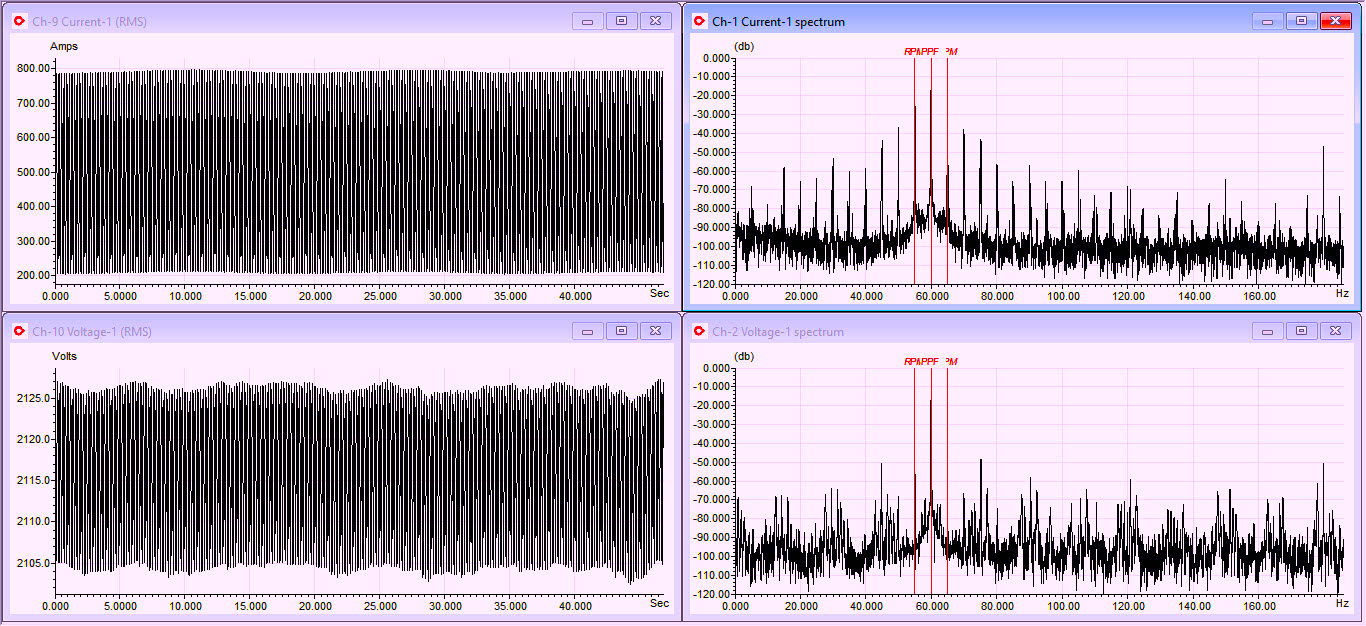
Fig. 1. Voltage (bottom) and current (top) low-frequency spectra data.
Even with the voltage noise in Fig. 2, the current data remains relatively clean, with the exception of the sidebands of running speed around the spectra line frequency peaks. In effect, 1X-rpm data off of a single test is especially difficult to evaluate. Figure 3 shows the spectra for voltage and current through 1500Hz, with a closer view of the peaks. In this figure, we can see that running speed peaks extend to many sidebands around line-frequency harmonics.
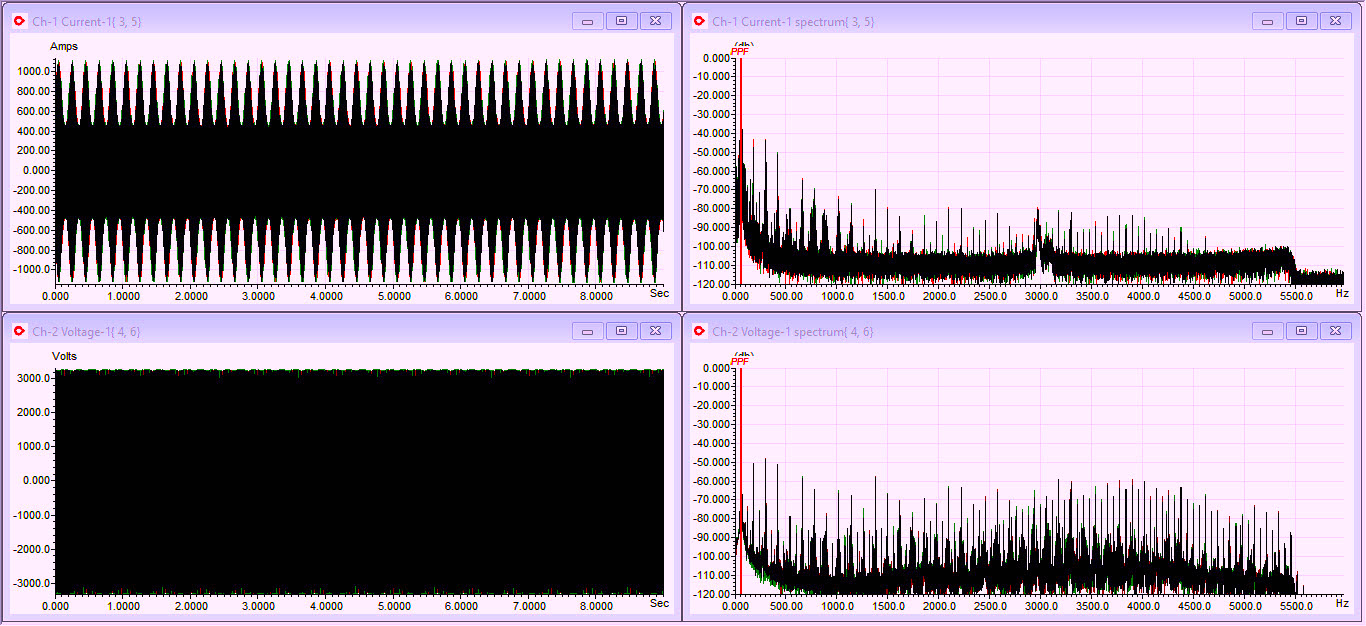
Fig. 2. Current (top) with RMS current “saw tooth” and noise in high-frequency spectra
and voltage (bottom) with noise from the power supply.
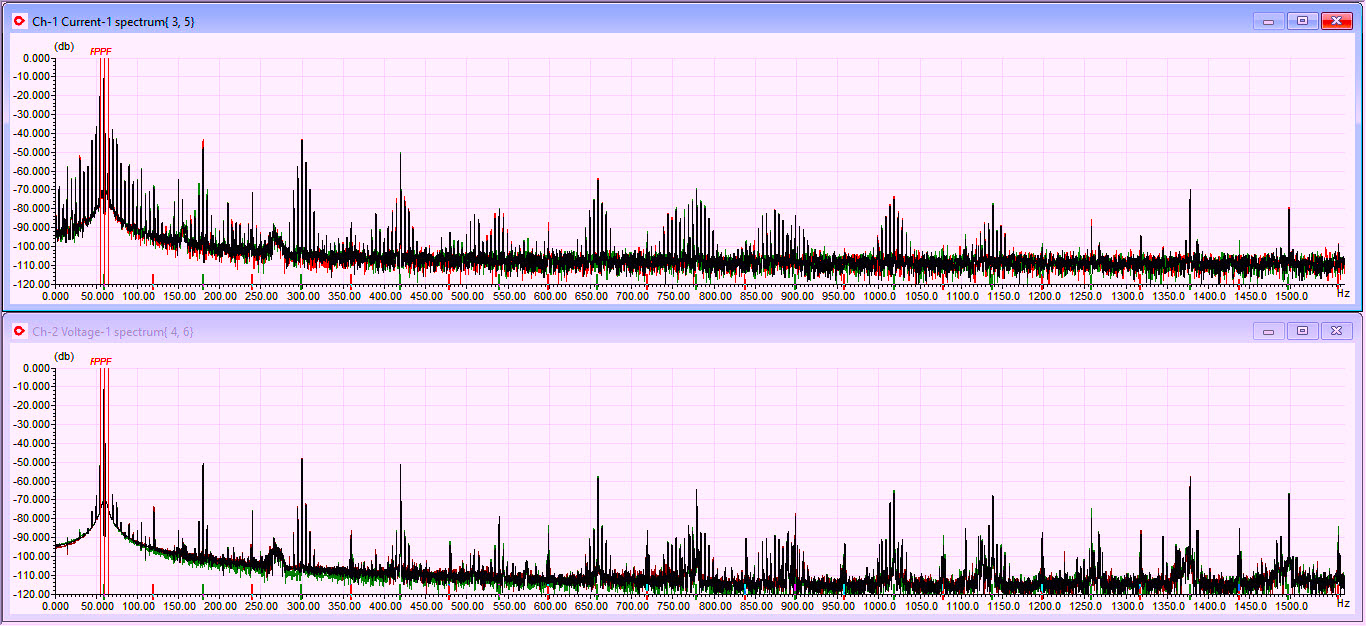
Fig. 3. Closer view of high-frequency spectra below 1,500Hz,
which covers slots and rotor.
In Fig. 4, we zoom in closer to the line frequency in the higher-resolution (low-frequency) range and see that the running speed peaks have a parallel peak. Note that peaks outside of the 1X-rpm peaks, including the areas between line frequency and running speed, can carry information such as pole-pass frequency and other conditions we can investigate. In this case, the concern is related to the parallel peaks to line frequency and deciding if they represent a problem.
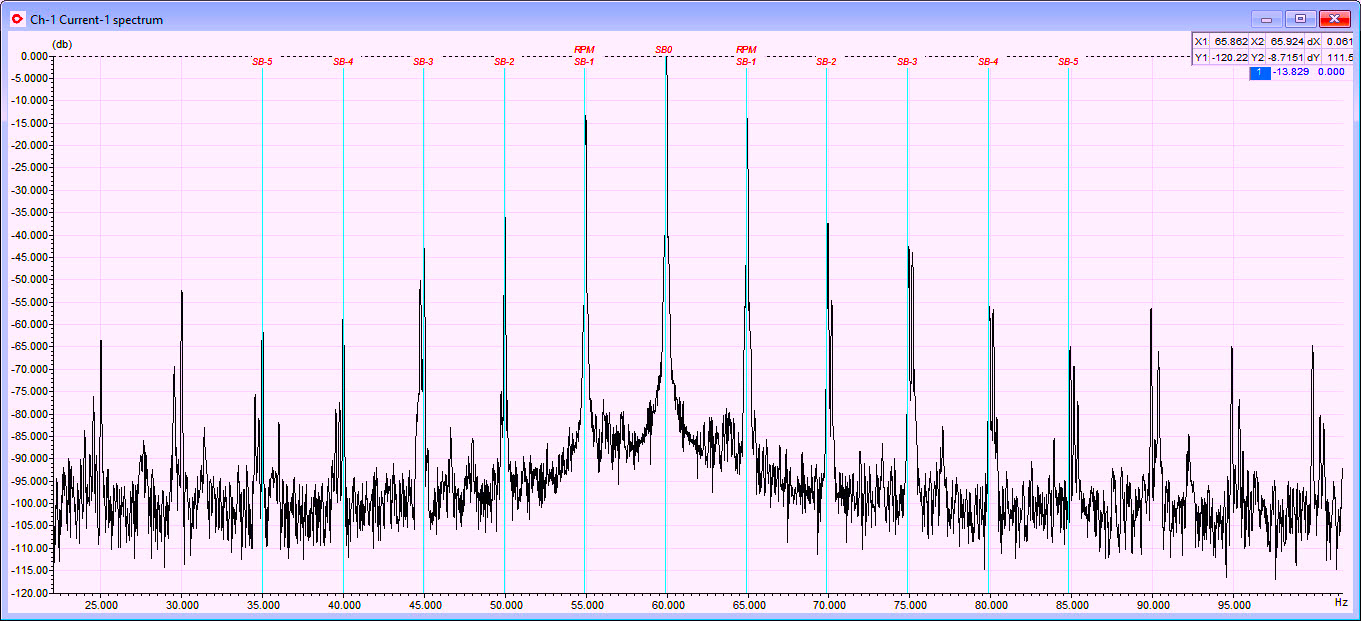
Fig. 4. High-resolution, low-frequency signature with running-speed harmonics
and parallel peaks close to running speed.
To determine if there are issues, we would need to have a good baseline, such as that shown in Fig. 5. As the spectra in this figure show, after overhaul of the synchronous motor, there were no parallel peaks. Based on experience, this type of signature would indicate looseness in either the motor bearings or reciprocating compressor. Additionally, the 1X-rpm peaks can be compared to determine if they are of greater magnitude than those in the baseline, which would indicate unbalance or alignment conditions.
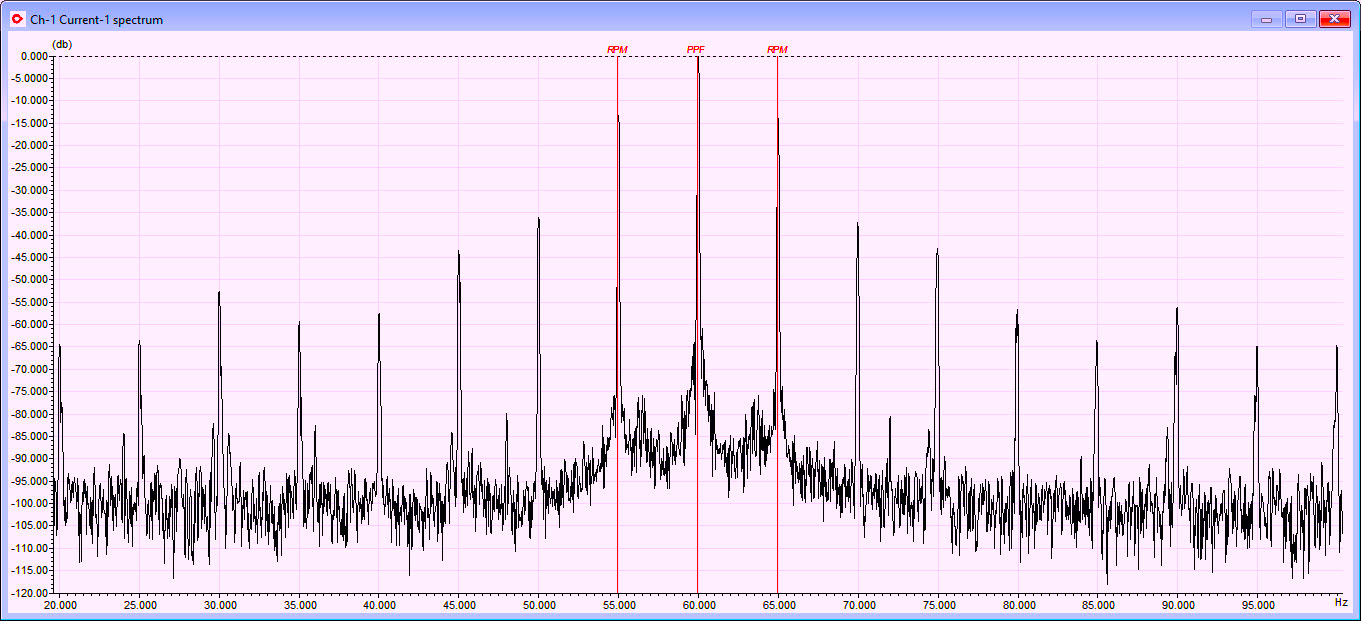
Fig. 5. Fresh data following an overhaul of the synchronous motor and compressor.
The 1X-rpm peaks in Fig. 5 are about the same amplitude as Fig. 4, and no parallel peaks exist. As previously identified, this would prompt additional investigation.
In the case of synchronous motors running reciprocating compressors, it is possible to perform ESA/MCSA on the system but only if there is a baseline. Otherwise, the recommended testing approach is to combine ESA and/or MCSA technology with other technologies, such as vibration analysis.TRR
ABOUT THE AUTHOR
Howard Penrose, Ph.D., CMRP, is Founder and President of Motor Doc LLC, Lombard, IL and, among other things, a Past Chair of the Society for Maintenance and Reliability Professionals, Atlanta (smrp.org). Email him at howard@motordoc.com, or info@motordoc.com, and/or visit motordoc.com.
Tags: reliability, availability, maintenance, RAM, electric motors, synchronous machines, reciprocating compressors, motor testing, Electrical Signature Analysis, ESA, Motor Current Signature Analysis, MCSA

