
Do you remember the old short story, “The Lady or the Tiger?” by Frank Stockton? It emphasized a crucial choice. In some ways, this case study is similar. It involves two critical pumps at a power plant and the decision as to which should be refurbished. There is no live “tiger.”
PROBLEM
A medium-sized power plant uses two large, single-stage, centrifugal pumps to supply cooling water. The two units and their electric-motor drivers are the same make, size, rating, and model. They also discharge into a common header.
The plant’s chief operator indicates that despite a rigorous condition-monitoring-based-maintenance program, these pumps have, over time, apparently, lost pumping capacity. She wants to know why. While this is a valid question, it’s important to note here that plant engineers are typically more involved than chief operators in resolving such problems.
BACKGROUND
Condition monitoring of the pumps is done, in this case, by tracking the amount of electric current their respective motors use when operating at full load. The supplied voltage to the motors is constant, and the pumps’ motor RPM speed is constant. There are no flow-measuring devices or pressure gauges on the discharge sides of the individual pumps. There is, however, a pressure gauge at the common header.
Flow is measured (but not regularly monitored) downstream of the header using ultrasound equipment on an ad hoc basis. The loss of pumping capacity has been noticed through a loss in cooling capacity and, occasionally, when measuring total flow with the ultrasound equipment.
The chief operator says that when an outage occurs, the pump with the highest operating amperage is removed, furbished, and then re-installed.
During outage downtime, both pump motors are tested in place using standard motor-testing methods to check for changes in resistance, inductance, capacitance, etc. Both motors have tested satisfactorily, have maintained their efficiency, and are well within operating standards.
Asked about the basis for checking the motor current as the primary condition-monitoring characteristic, the chief operator indicates that when a pump becomes less efficient due to impeller and bowl wear, it uses more power to produce the same amount of flow. Thus, the pump with the highest amperage is removed and refurbished.
When a pump is removed and sent out for refurbishment, the vendor is told that the unit is worn and using too much power. Post-refurbishment, the information coming back from the vendor notes that the cavitation spots were filled in by braze-welding and smoothed out by grinding, and that impeller-blade areas, which had thinned too much, were ground away and re-contoured to match the impeller profile as closely as possible.
Over time, though, this approach to refurbishment has reduced the area of each pump’s impeller blades, to some extent, and has also somewhat modified the impeller profiles from their original forms.
When the refurbished pump is re-installed, the amperage is lower than before and more or less matches that of the other pump that’s still in place. The chief operator considers matching amperages in this way to be a desirable refurbishment goal.
When the refurbished pump is re-installed, the amperage is lower than before and more or less matches that of the other pump. The chief operator considers matching amperages in this way to be a desirable refurbishment goal.
ASSESSMENT
Figure 1 is a generic pump curve for a single stage, centrifugal pump, sometimes called a propeller pump. As a point of reference, this type of pump is commonly used in power plants and industrial locations to lift and pressurize cooling water for circulation through the plant.
Here’s what’s important to note in the pump curve shown in Fig. 1:
1. As pump flow increases, pump head decreases. The drop in head pressure with respect to flow is non-linear, especially in the area of best operating efficiency. Note that near and at the peak efficiency of the pump, the discharge flow can very greatly while the efficiency may not appreciably change at all.
2. As pump flow increases, the amount of power needed by the motor increases. The pump discharge flow versus the brake horsepower required by the motor is approximately linear within the usual range of operating the pump. That’s because, within the needed accuracy of this article, the amount of power required to operate the pump is directly proportional to the amount of water being pumped. In short, more pumped water requires more power supplied by the motor.
3. Pump mechanical efficiency versus either head or brake horsepower is also non-linear. Efficiency increases as pump head decreases up to a point, reaches a maximum of perhaps 75% to 90% or so in a well-maintained pump, and then drops as head further decreases. For best economy of operation, most pumps are run at or near the maximum pump efficiency point. Sometimes, this is called the best-efficiency zone or area. Figure 1 shows this area as a box.
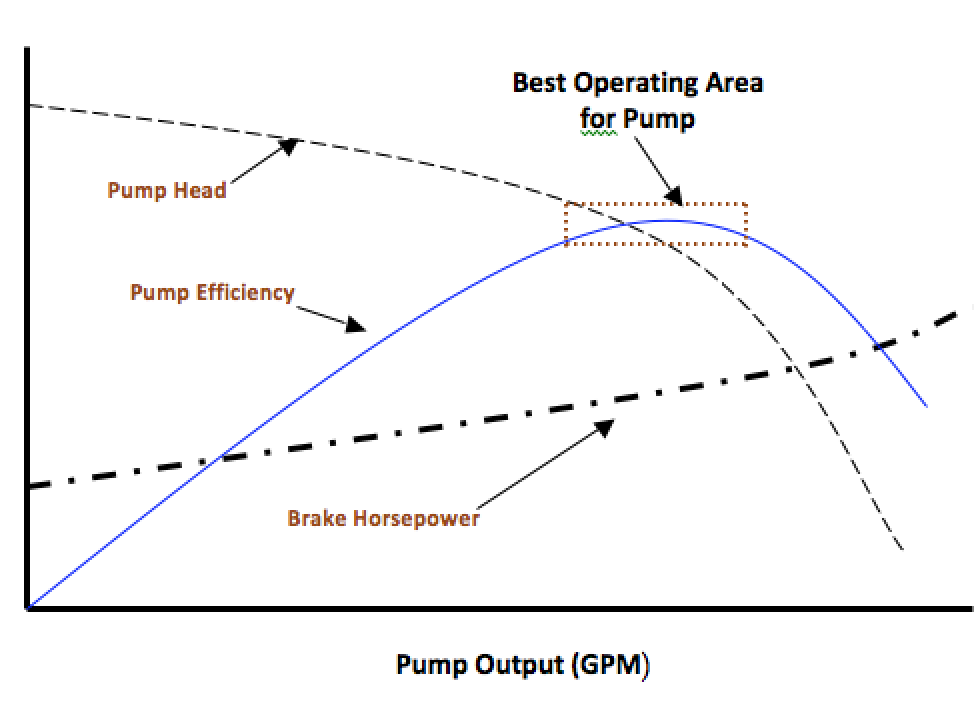 Fig. 1. Generic pump curve for centrifugal pump.
Now consider Fig. 2, which follows (and shows) what happens when the same centrifugal pump becomes worn. The pump curves for head and efficiency shift slightly downward and toward the left. The brake horsepower curve remains basically about the same.
As depicted in Fig. 2, pump A reflects a unit that’s in tip-top condition. Pump B is the same pump, but worn in the bowl and impeller so that its performance is reduced. In both cases, the lift adjustment is optimized so that the different pump conditions aren’t a factor in the comparison. The discharge flow from pump A is labeled Qa. The discharge flow from pump B is labeled Qb.
Figure 2 indicates that to match the same discharge pressure as before, the worn pump B will produce less head than pump A, as well as produce less discharge flow. Consequently, pump B will require less power from its motor. In short, given the same discharge pressure, the pump that is worn and not performing as well as the unit in tip-top condition will use less current.
Similarly, consider the case of two pumps, one in good condition and one that is worn, discharging into the same header. Figure 2 also represents that situation. Pump A is the good or strong pump of the two, and pump B is the weak or bad pump.
Both pumps have the same discharge pressure as shown by the heavy, horizontal line. This is because they both push against the same internal flow friction of the plant. By discharging into a common header, their discharged pressures are equalized. As a result, the pump curve for B pump indicates it will produce less flow, and its electrical motor will then use less power than the A pump. In other words, the bad pump will use less current than the good pump.
Alternately, what if instead of equalizing pressure by discharging into a common header, the two pumps equalized their discharge flows by having wholly separate flow paths? Assuming that the two individual flow paths have symmetrically the same flow resistance, Fig. 2 can be used to show what could occur.
Equal discharge flows can be represented in Fig. 2 by extending a vertical line downward from the pump A head curve to the pump B head curve. Thus, pump B (the worn or degraded pump), can achieve the same flow output as that of pump A, but at a cost of having a lower discharge pressure than pump A. This is achievable if there’s sufficient operating margin in the B-side cooling water system to begin with, and there are valves located in the B-side’s downstream flow pathway that can be re-adjusted to equalize discharge flow with the A side.
Unfortunately, the lower discharge pressure on the B-side discharge flow would likely affect some of the heat-exchanger-performance parameters in that portion of the plant. Thus, one side of the plant, the A pump side, would perform as expected, but the B-pump side’s performance would be different.
Alas, the chief operator had it backwards: The good pump was being removed, and the vendor was reducing the unit’s capacity by trimming the blades to match the lower electrical current usage of the bad pump. Therefore, the overall pumping capacity was being incrementally degraded with each outage.
Of course, given her background and demanding role in the plant, the chief operator shouldn’t have been expected to make such a nuanced decision in the first place. Making the call on which pump should be refurbished was an engineering decision—one that clearly warranted the involvement of the plant engineer.
THE IMPLICIT FALLACY
What was wrong with the chief operator’s logic in determining the pump to refurbish?
Her mental picture regarding the operation of the pumps was similar to that of a single input and single output function: Electrical energy was being put into a device, and pump work was the output.
In that model, if the input is 100 units of energy, and the output is 80 units of mechanical work, the overall efficiency is 80%. But, if the efficiency of the device drops to, say, 75% due to internal wear, the input energy has to be increased to 107 units of input electrical energy to maintain the same output of 80 units of mechanical work.
There’s an implied assumption in the above logic that the two pumps are pumping about the same amount of water, that is Qb = Qa. When one of the two pumps is worn, however, that assumption is false. Each pump follows its own particular pump curve for the condition it is in. As noted in Fig. 2, a worn pump has a different pump curve than one in tip-top condition.
Figures 1 and 2 both show that there is not one output parameter for each pump: There are two. This is fundamental. The output energy is divided between pressure and flow. (The kinetic energy of the flowing water is ignored here, since it is small relative to the other energy parameters.)
Due to the physical constraints imposed as described in each pump’s performance curve, the units can only operate on a point that lies on their particular performance curves. Thus, if output pressure is prescribed, the corresponding head component is locked in. Likewise, if the output head is prescribed, the corresponding flow component is locked in.
To be clear, the actual output energy is not a single variable as was tacitly assumed by the chief operator: It is divided between two variables and is further constrained by the pump’s specific operating curve.
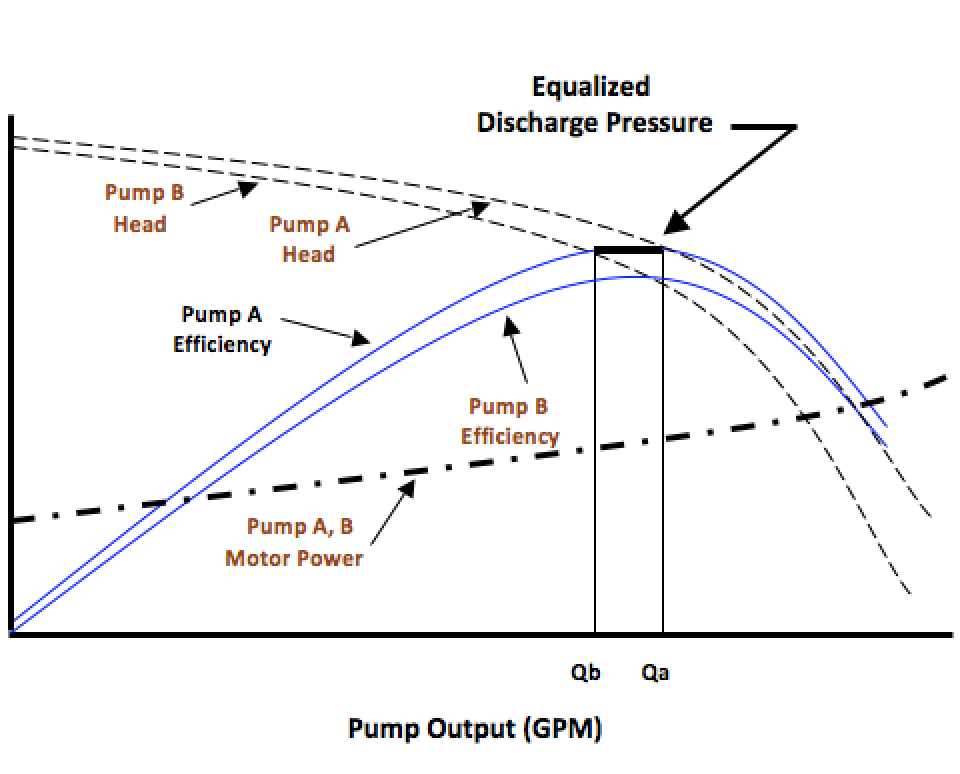 Fig. 2. Two pump diagrams together, one “strong,” one “weak.
In sum, the error in the chief operator’s logic was the belief that the pumps in question acted like devices with only one input variable and one output variable. In fact, each pump has one input variable and two output variables.
TWO-HORSE ANALOGY SUMMARY
If the above discussion is a bit confusing, think of it this way: Two horses are hitched side by side to pull the same loaded wagon. One horse is a strong Clydesdale. The other is a riding pony. They will not equally pull the wagon. The stronger horse will pull a larger share of the total load. The weaker pony will, of course, not pull as much.
So, when the unbalance in draw is no longer tolerable and the Clydesdale is pulling its share of the load along with some of the pony’s share, do you take away the Clydesdale and replace it with a riding pony, or do you replace the weaker pony with a Clydesdale?
SOLUTION
The fact that the B pump is slacking off and producing less flow at the same pressure as the A pump, is hidden by: 1) the fact that the two flows are combined at the common header; and 2) the fact that the stronger A pump tends to make up the difference in flow by pumping more.
This problem can be remedied by regularly monitoring the discharge flow of each pump. In this way the disparity will be obvious.
A BETTER SOLUTION
In addition to the above solution, i.e., regular discharge-flow monitoring, periodic pressure-versus-flow testing should be conducted to establish the current pump curve, rather than depend on a cut-sheet pump curve supplied by the OEM. For a centrifugal pump, only three well placed test points are needed to draw a usable current pump curve for each pump, although four such points would certainly be better than three.
Tracking changes over time in each pump’s performance curve would certainly leave no question as to which unit should be serviced and when. Further, instead of cleaning up the “bad” areas in the pump when it is removed and refurbished, the impeller blades and bowl should be restored to their original dimensions and profiles to maintain the pump’s original performance characteristics.
Finally, it’s important to note that chief operators typically don’t deal with the establishment of condition-monitoring parameters and decisions related to refurbishment of pumps.
With regard to this particular case study, the plant engineer probably should have been more involved in determining the root cause of the problem and providing the ultimate solution. It is assumed that he or she would have a strong understanding of how best to gather and apply pump-curve data. Chief operators already have countless other things to worry about in a plant—and are not expected to be well versed in the nuances of pump curves.TRR
ABOUT THE AUTHOR
Randall Noon is a registered professional engineer and author of several books and articles about failure analysis. He has conducted root-cause investigations for four decades, in both nuclear and non-nuclear power facilities. Contact him at noon@carsoncomm.com.
Tags: fluid handling, operations, maintenance, reliability

