
During the 1990s, the U.S. Department of Energy (USDOE, energy.gov) and industry partners developed additional methods for load and efficiency testing that could be easily performed in the field with standard electrical instruments. While they may not be as exact as IEEE 112 Method B/CSA 390 laboratory or Electrical Signature Analysis (ESA) methods using ORMEL 96 (which were discussed in our Feb. 7, 2022, article, see link below), the additional methods can provide a footprint of the condition of the electric-motor fleet in a plant. In addition, they offer a down and dirty method of acceptance testing for repaired and new electric machines, as reduced efficiency normally indicates a defect.
Click Here To Read Part II Of This Series
There are a few caveats, however, including the fact that pre-repair efficiency should have been recorded for repaired electric motors. A repair shop can improve base efficiency through the repair process (which is a more likely scenario than a good repair reducing efficiency). This means a motor that started with a low efficiency or was damaged in an earlier repair cannot be expected to meet even the nameplate efficiency. The nameplate efficiency is also the “nominal” or average efficiency, with many a motor measuring slightly below the nameplate value unless it is an IEEE 841 or other type with guaranteed minimum efficiency. The methods that are highlighted in this article attempt to compensate for voltage variations in operation and can be within 0.5% to 2% of the actual motor efficiency, using the USDOE worksheets, or higher when using just the calculations in this article.
The USDOE document titled, “Determining Electric Motor Load and Efficiency,” can be downloaded directly at the following link: Determining Electric Motor Load and Efficiency (energy.gov). Additional technical notes and tips can be found at this link: Motor Systems | Department of Energy. (Note: These sources/links can change from time to time, as the websites are updated). The methods described for load and efficiency tests are relatively accurate when a motor is loaded over 50%, with the efficiency curve peaking at an average of 85% of load. Because the efficiency is a curve (as we described in Part II of this series), knowing the load when you’re estimating the efficiency is important. When testing for efficiency based on load, we are primarily observing a change in the power factor of the motor due to some stator, rotor, or winding anomaly.
As shown in Equation 1, with E being average voltage, I is the average current, Eff as motor efficiency, and PF as power factor, there are a few items that will affect the efficiency. In the remainder of this article, we will observe methods identified in the previously cited USDOE document, “Determining Electric Motor Load and Efficiency,” and how they can be applied. 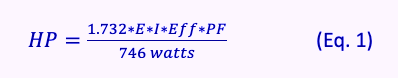
If we just know a motor’s voltage and current, we still have a simple method for determining the load. First, we must take the average of the measured True RMS voltage and current by adding them together and dividing by three. Equation 2 (below) is then applied with I as the average current, V the average voltage, In the nameplate current, and Vn the nameplate voltage.

Therefore, if we have a 100-hp motor with a nameplate of 460 Vac and 130 Amps, and it’s drawing 470/473/468 Volts and 110/114/109 Amps, the average voltage would be 470.3 Volts and average amps would be 111 Amps. When applied to Eq. 2, the load would be 87.3%.
The next method is the “slip’ test. It uses the running speed of the electric motor to compare to the nameplate speed and synchronous speed of the motor. This is significantly less accurate than the voltage and current method, as it doesn’t compensate for the impact of speed by voltage levels or unbalance, in addition to the 20% tolerance allowed for nameplate speed. Equation 3 (below) uses the synchronous speed (Ns), the measured speed (Nm) and the nameplate speed (Nn).

In the case of our 100-hp motor, if it has a nameplate of 1785 rpm and a measured speed of 1788 rpm, the load would be 80%. We can influence the measurements some by including voltage, as shown in Equation 4 (below).

Using the information in the examples above, the load of a 100-hp motor would be 83.6%.
As the nameplate tolerances for speed and current are substantial, the use of voltage and current for determining the load are typically quite accurate. Equation 5 (below) can be used to estimate the efficiency and then compare that estimate to the tables in the USDOE document. This does require that the input power in kilowatts (PI) is measured.
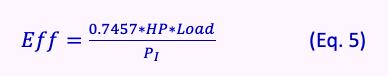
If we then take kilowatts from the 100-hp electric motor (68.6 kW measured) and apply the voltage and current method for load above, we come up with 0.949 (or 94.9% efficiency). The worksheets in USDOE’s load and efficiency document walk users through the process with some modifications that bring the efficiency levels closer to what’s expected.
CONCLUSION
Methods developed and published by USDOE allow a motor owner or service company to estimate the unit’s efficiency. These methods provide tools for before-and-after testing to verify the impact on motors from repairs and other processes.
Keep in mind that direct calculations discussed in this article may vary significantly among dedicated ORMEL 96 methods, ESA, laboratory testing, and IEEE 112 Method B/CSA 390. Consequently, the values shown in the calculations may be of limited use in determining plant energy and associated losses.TRR
ABOUT THE AUTHOR
Howard Penrose, Ph.D., CMRP, is Founder and President of Motor Doc LLC, Lombard, IL and, among other things, a Past Chair of the Society for Maintenance and Reliability Professionals, Atlanta (smrp.org). Email him at howard@motordoc.com, or info@motordoc.com, and/or visit motordoc.com.
Tags: reliability, availability, maintenance, RAM, energy efficiency, electric motors, Electrical Signature Analysis, ESA, U.S. Department of Energy, USDOE, energy.gov, IEEE 112-2017, ORMEL 96, MEASUR software

