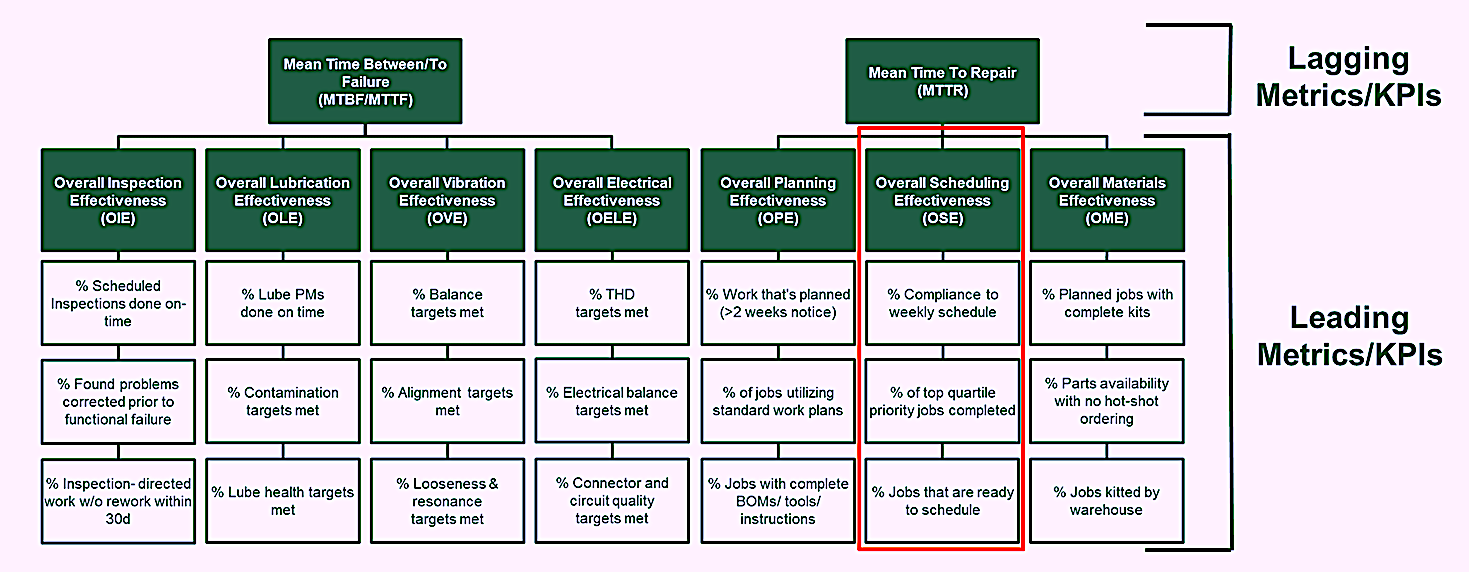
In this week’s edition of The RAM Review, we continue our focus on proactive leading metrics. Last week, we addressed Overall Planning Effectiveness (OPE), which helps drive down Mean Time to Repair (MTTR) and drive up work quality. This week, as the above title points out, our attention is on another major indicator driving proactive behaviors that reduce MTTR and increase work quality: Overall Scheduling Effectiveness (OSE).
 Fig. 1. Overall Scheduling Effectiveness (OSE) is a leading indicator
that drives proactive behaviors, which, in turn, drive asset reliability.
WHAT OSE IS AND WHY IT’S IMPORTANT
Ultimately, the goal of the planning, scheduling, and maintenance-work-management process is to get as much high quality, top-priority work completed as possible. In most plants, non-Shutdown, Turnaround, or Outage (STO) maintenance work that is going to be scheduled for the following week is agreed to in a scheduling meeting (typically on Wednesday or Thursday of the current week to allow a day or two for adjustments). The schedule is agreed upon as a byproduct of a job priority-based joint challenge that typically includes maintenance and operations leadership. The Overall Scheduling Effectiveness (OSE) metric is intended to drive proactive maintenance- work-scheduling behaviors that will help ensure this goal is met.
OSE is calculated as the product of multiplying the following three input factors (Fig. 2):
1. Percentage of jobs assigned to the weekly schedule that were
actually completed, i.e., compliance to schedule.
2. Percentage of top-quartile priority jobs that were completed.
3. Percentage of jobs that are ready to schedule.
 Fig. 2. The simple formula for OSE, which is the product of multiplying
the ‘behavioral inventories’ for the three input factors.
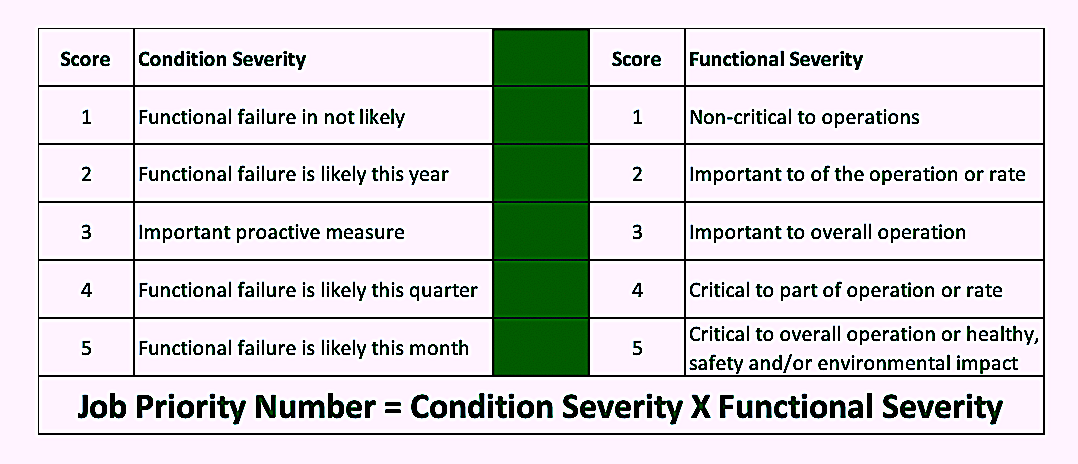
Integral to the OSE metric is the relative importance of each candidate job. I suggest creating a process for assigning a Job Priority Number (JPN) to each job that’s being considered for inclusion in the next week’s schedule. A simple example of such a prioritization system is illustrated in Fig. 3. In it, an assigned Condition Severity Score (CSS) of 1 to 5 is multiplied by a Functional Severity Score (FSS) of 1 to 5 that’s assigned to all jobs. This results in a JPN range of 1 to 25 (wherein 1 is the lowest priority and 25 the highest priority). It’s worth noting, as your asset-management effectiveness improves, the average JPN for all demanded maintenance jobs should reduce. This is a clear indicator that you’re becoming more proactive in managing the reliability of your equipment assets.
 Fig. 3. A simple example of a pseudo-quantitative scoring system f
or assigning priority to jobs that are available to schedule.
Assigning a JPN to each job lets us organize the demanded jobs in accordance to the four-box urgency vs. importance matrix from Stephen Covey’s 2003 book, The 7 Habits of Highly Effective People. The Covey “Urgency vs. Importance Matrix” can be adapted to the maintenance JPN scoring and ranking system to visually reflect what work is most important.
 Fig. 4. Stephen Covey’s famous “Urgency vs. Importance Matrix,”
adapted to the maintenance Job Priority Numbering (JPN) System.
As is the case with other leading metrics, we must view the OSE elements as an inventory process of binary observations: The job complies, or it doesn’t. Each element of the OSE metric is displayed as a percentage of the complying observations divided by the total number of observations and converted to a percentage. The OSE is the product of multiplying the three components together. If OSE increases, we’re practicing behaviors that will drive MTTR down, which is our goal. Let’s explore the three components of OSE in more detail.
1. Percent Compliance to the Weekly Schedule
Success in the scheduling-process endeavor depends upon compliance to the weekly schedule. Deviations occur in the form of break-down or break-in work that’s identified within the current schedule week. Break-down work occurs as a result of a functional failure that affects all or part of production and/or introduces an unacceptable safety and/or environmental risk. Break-in work occurs when a high- risk condition observed inside the current schedule week is deemed high enough to break into the schedule and bump a job that was originally scheduled.
A break-down job often leaves us with little choice: We may need to bump a scheduled job to get the plant up and running or clear a safety or environmental issue. Break-in work is a bit trickier, as it requires real-time reshuffling of work priorities (sometimes without complete JPN details about the demanded break-in job). We often reflect on a week’s work and conclude that we bumped an important scheduled job to deal with a break-in job that, in retrospect, would have carried a lower JPN had our analysis been more complete. Therefore, it is crucial to carefully consider a job’s importance and its urgency.
Compliance to the weekly schedule is simply the number of jobs that were completed and scheduled divided by the total number of jobs that were scheduled, expressed as a percentage. So, if 20 jobs were scheduled and 16 of them were completed, the Percent Compliance to the weekly schedule is 80%, based upon the raw, binary “Yes vs No” job-completion status. It is possible to additionally track a weighted value to reflect the different values associated with completing a 10-crew-hour job as comparted to a 2-crew-hour job. (FYI: I’ll be explaining this particular process in more detail in a future article for The RAM Review.)
Note that I usually encourage my clients to schedule 120% or 125% of their available crew-hours. Thus, if I have 160 crew-hours of available labor for next week, I will schedule 200 crew-hours of work (125% of the available crew-hours). The reason for this is simple: The goal for scheduling is to complete as much of the highest-priority work that’s possible, given the available crew-hours. Sometimes, a scheduled job is bumped due to an unanticipated unavailability of parts, tools, contract labor, etc. So, it’s always good for the foreman or supervisor to have some wrench/spanner-ready go-to jobs in his or her back-pocket. Of course, these “extra jobs” can’t require much prework, special-tool hire, or contract labor to complete. Interestingly, I often get push-back on this approach. When I ask why, it comes down to optics. If I have the manpower for 20 jobs next week and I bump the number to 125% (or 25 jobs), and we complete the same 16 jobs, our compliance percentage drops from the previous 80% to 64%. Yes, this would look bad. However, by multiplying 64% by the 125%, we arrive back to an 80% compliance. (Isn’t math beautiful?) The math for calculating the adjusted compliance percentage is a little more complicated, but it’s still simple arithmetic. (I’ll address this topic in that previously mentioned future article.)
2. Percentage of Top Priority Jobs Completed
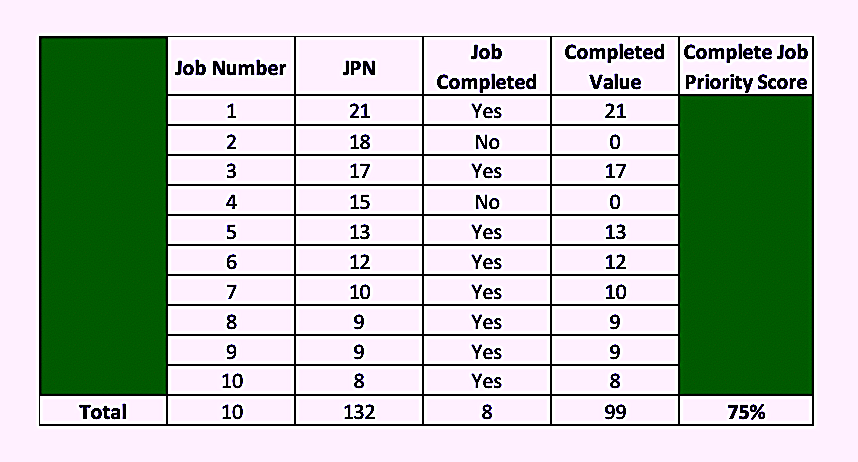
The schedule compliance components of the OSE addresses the total amount of work completed. The Percentage of Top Priority Jobs Completed component assures that we’re focusing on the most important work. Unlike other elements in this series of leading metrics that are essentially an inventory of binary “Yes vs. No” inputs, this value requires that we sum the total JPN values for all jobs on the schedule. Then we sum the JPN score for all scheduled jobs that we completed (Yes or No [binary in that sense]) and divide the sum value of their JPNs by the sum value of the JPNs for all scheduled jobs and express it as a percentage. Referring to Fig. 5, we see that the sum of the JPN values for the 10 scheduled jobs is 132 JPN points. Eight of those jobs were completed, thus reflecting a total of 99 of the 132 JPN points scheduled, or 75% of the total JPN points scheduled for the week.
 Fig. 5. Example of the process from calculating the
Percentage of Top Priority Jobs Completed
component of the OSE metric.
3. Percentage of Scheduled Jobs That Are Ready to Schedule (RTS)
Chasing down parts is a big crew-utilization killer. Failure to erect scaffolding, awaiting permits and access to the equipment, waiting for special tool and a host of other issues adversely affect crew productivity and, in some instances, work quality. So-called wrench/spanner time depends upon our crews having the parts and tools they need to complete the job. Materials management ties the planning, scheduling, and warehouse- management functions together. You can bet that if our crews spend most of their time seeking parts, our job-completion compliance will suffer, and our performance in completing top-priority jobs will likely suffer as well. Note: It is the job of the scheduler to ensure that a job is Ready to Schedule (RTS). To do that, the scheduler must coordinate with the planner, the materials warehouse, operations, and other stakeholders to assure the following boxes (shown in the graphic below) are ticked and confirm that the job is a go:

IN CONCLUSION
Minimizing Mean Time To Repair (MTTR) is essential for increasing production availability in the plant. Doing so requires effective scheduling of maintenance work. The scheduler must first assure that a job is in a Ready to Schedule (RTS) status from a planning and materials perspective. Then, he or she must coordinate a joint challenge between maintenance, operations, and other stakeholders to assign or adjust the Job Priority Number (JPN) for each job.
It’s my advice that we schedule 120% to 125% of available crew-hours to ensure that we have enough wrench/spanner ready-work to address scenarios where a higher-priority job is bumped for one reason or another. By monitoring the three elements of Overall Schedule Effectiveness (OSE), you can drive proactive behaviors in the plant that will decrease your MTTR, improve work quality, and boost crew utilization or wrench/spanner-time performance.
The next installment of this series on proactive leading metrics will cover Overall Materials Effectiveness (OME).TRR
REFERENCES:
Covey, S. (2003). The 7 Habits of Highly Effective People: Restoring the Character Ethic (1st Free Press trade pbk. ed.).
New York: Free Press.
ABOUT THE AUTHOR
Drew Troyer has over 30 years of experience in the RAM arena. Currently a Principal with T.A. Cook Consultants, he was a Co-founder and former CEO of Noria Corporation. A trusted advisor to a global blue chip client base, this industry veteran has authored or co-authored more than 300 books, chapters, course books, articles, and technical papers and is popular keynote and technical speaker at conferences around the world. Drew is a Certified Reliability Engineer (CRE), Certified Maintenance & Reliability Professional (CMRP), holds B.S. and M.B.A. degrees. Drew, who also earned a Master’s degree in Environmental Sustainability from Harvard University, is very passionate about sustainable manufacturing. Contact him at 512-800-6031, or email dtroyer@theramreview.com.
Tags: reliability, availability, maintenance, RAM, metrics, key performance indicators, KPIs, planned maintenance, work instructions, standardized work plans, wrench time, job-safety analysis, Overall Scheduling Effectiveness


