
My recent articles on leading metrics designed to drive proactive behaviors at a site have focused on improving Mean Time Between/ To Failure (MTBF/MTTF) of plant assets. These included Overall Inspection Effectiveness (OIE), Overall Lubrication Effectiveness (OLE), Overall Vibration Effectiveness (OVE), and Overall Electrical Effectiveness (OELE). In this week’s article, we are turning our attention to leading indicators for driving behaviors that improve Mean Time To Repair (MTTR). We start with Overall Planning Effectiveness (OPE), as illustrated in Fig. 1.
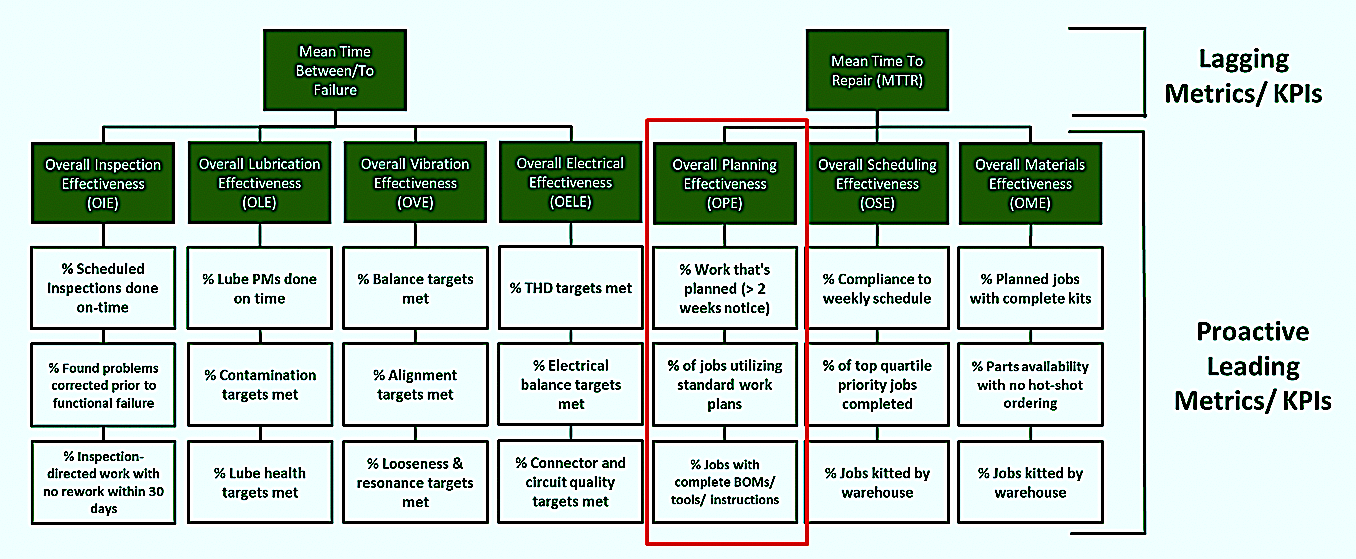
Fig. 1. Overall Planning Effectiveness (OELE) is a leading indicator
that drives proactive behaviors, which, in turn drive asset reliability.
WHAT OPE IS AND WHY IT’S IMPORTANT
Maintenance planning is essential to assuring that maintenance work will be executed effectively, efficiently, and safely. Maintenance planners create work plans that provide maintenance technicians with the information they require to execute preventive and corrective maintenance work with a high degree of precision. They are also responsible for assuring that Front-End Loading (FEL) tasks are completed prior to the start of active work. Those FEL tasks include: a) organizing parts and materials kits and staging the kits at the job, where appropriate; b) completing pre-work activities, such as the erection of scaffolding; c) organizing and securing special tools, including hire-in tools: d) organizing any special skills, such as non-destructive testing (NDT) specialists, that are required for the job; and e) arranging with production management for access to the equipment, as required. Failure to effectively plan maintenance work results in poor-quality execution and poor “wrench-time” performance, which is a measure of maintenance-craft utilization.
OPE is calculated as the product of multiplying the following three factors (Fig. 2):
1. Percentage of maintenance work that is planned. This usually requires
at least two weeks of advance notice (longer for more complex jobs).
2. Percentage of jobs utilizing standard work plans.
3. Percentage of jobs with complete bills of material (BOMs), defined
tool requirements and clear and complete work instructions.
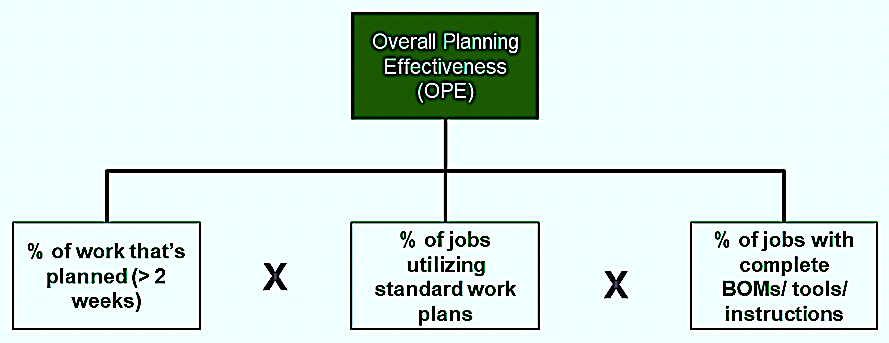
Fig. 2. The simple formula for OPE, which is the product of multiplying
the ‘behavioral inventories” for the three input factors.
As is the case with other leading metrics, we must view the OPE elements as an inventory process of binary observations: The job complies, or it doesn’t. Each element of the OPE metric is displayed as a percentage of the complying observations divided by the total number of observations and converted to a percentage. The OPE is the product of multiplying the three components together. If OPE increases, we’re practicing behaviors that will drive MTTR down, which is our goal. Let’s explore the three components of OPE in more detail.
1. Percentage of Maintenance Work That’s Planned (> 2 weeks notice)
Planning maintenance work takes time if it’s to be done correctly. Planners must first get a clear handle on the job’s scope. Then, they must organize for parts, materials, tools, special skills, and work instructions that are necessary to complete the job effectively and efficiently. A good rule of thumb is that if a job is requested at least two weeks prior to its required scheduling, it’s not planned work: It is either break-in work, meaning it breaks into an existing work schedule; or it’s break-down work, meaning the machine or equipment system has functionally failed.
Note that for complex maintenance jobs, for plants that are remotely located, or for jobs that have long lead times on parts, tools, or preparation, two weeks isn’t enough time to properly plan the work. Achieving a high score for percentage of work that’s planned is very dependent upon the previously discussed Overall Inspection Effectiveness (OIE) metric, the effectiveness and clarity with which maintenance notifications are written, and the effectiveness and accuracy of the gatekeeping and approval processes.
2. Percentage of Jobs Utilizing Standard Work Plans
It’s unlikely that your plant will get through a day without some type of failure. You surely won’t get through a week without one or more failures. However, it’s also unlikely that the type of required maintenance job will not have been performed at the site previously. One of the great levers of the maintenance-planning process is that, when executed properly, it takes advantage of the repeatable nature of maintenance work.
While it varies somewhat by industry, at least 90% (usually more) of all maintenance work can be standardized with respect to BOMs, tool requirements, skill requirements, and work instructions, to include fit, tolerance, quantity, and quality details. In fact, even the job safety/ hazards analysis (JSA/JHA) can be standardized, assuming the location is considered. Remember, though, that, a standard JSA/JHA should not replace SLAM (Stop, Look, Assess, Mitigate), which is the responsibility of every craftsperson, technician, and supervisor.
Unfortunately, many maintenance-planning departments waste time and energy planning the same job again and again. In addition to being wasteful, this introduces variability in job plans from one instance to another, which creates unnecessary complexity and confusion that leads to mistakes. Where possible, steps or subcomponents of a job should contain the same language as common steps and subcomponents on another job. Your craft-to-planner ratio is a relatively accurate indicator of your standardization effectiveness. If the ratio is less than 15:1, your standardization is probably poor. If it is about 20:1, your standardization is probably good. If your ratio greater than 25:1, your standardization is almost certainly excellent. Strive to standardize all aspects of maintenance (including work notifications and gatekeeping and approval processes) to improve work quality and efficiency.
3. Percentage of Jobs with Complete BOMS, Required Tools and Work Instructions
When maintenance workers are required to go back to a storeroom to chase down parts, or worse, call a vendor to arrange for parts, wrench-time suffers. If a job is urgent, the craftsperson may be required make do with sub-standard parts or even raid the plant’s boneyard to scavenge items to complete the job. That sets the stage for the next failure. Likewise, if maintenance personnel must chase down the right tools, make do with suboptimal ones, wait for instructions, or proceed based upon guesswork, wrench time and/or work quality will suffer. We want to inventory the number of jobs that go smoothly with respect to these vital elements of the job plan. In fact, the work plan should not proceed to scheduling if these elements are missing.
Tracking this factor will require craftspersons (or their supervisors) to always complete simple post-job surveys that ask these three yes or no questions: 1) “Was the BOM compete and accurate?” 2) “Were all required tools specified?” and 3) “Were work instructions clear and complete?” You could also ask if prework, e.g., scaffolding, was complete, and if access to the equipment from production or permitting was arranged prior to arrival at the job site.
IN CONCLUSION
Minimizing Mean Time To Repair (MTTR) is essential for increasing production availability in the plant. Doing so requires effective planning. Keep in mind that effective planning increases craft utilization (wrench-time), quality of work execution, and on-the-job safety. Standardization of maintenance plans and the planning process creates work-plan consistency and planning efficiency. Monitoring Overall Planning Effectiveness drives proactive behaviors on the plant floor that, in turn, deliver the type of MTTR performance you desire (and which every site banks on for maintenance success).
The next installment of this series on proactive leading metrics will examine Overall Scheduling Effectiveness (OSE).TRR
ABOUT THE AUTHOR
Drew Troyer has over 30 years of experience in the RAM arena. Currently a Principal with T.A. Cook Consultants, he was a Co-founder and former CEO of Noria Corporation. A trusted advisor to a global blue chip client base, this industry veteran has authored or co-authored more than 300 books, chapters, course books, articles, and technical papers and is popular keynote and technical speaker at conferences around the world. Drew is a Certified Reliability Engineer (CRE), Certified Maintenance & Reliability Professional (CMRP), holds B.S. and M.B.A. degrees. Drew, who also earned a Master’s degree in Environmental Sustainability from Harvard University, is very passionate about sustainable manufacturing. Contact him at 512-800-6031, or email dtroyer@theramreview.com.
Tags: reliability, availability, maintenance, RAM, metrics, key performance indicators, KPIs, planned maintenance, work instructions, standardized work plans, wrench time, job-safety analysis, Overall Planning Effectiveness

