
My multi-installment focus on leading metrics that drive proactive asset-management behaviors on the plant floor continues here with a look at Overall Vibration Effectiveness (OVE). The discussion is particularly timely, following the June 13, 2021, installment (see link below) on Overall Lubrication Effectiveness (OLE).
Along with its companion leading metrics shown in Fig. 1, OVE is intended to drive proactive behaviors that ensure plant equpment runs free of the destructive vibrations that occur when a machine is unbalanced, misaligned, not tightened properly, and/or operating at a resonant frequency. The OVE metric intentionally excludes the predictive aspects of vibration-analysis-based predictive condition-monitoring activities intended to detect defective or worn-out bearings and other machine components that must be replaced or repaired. Rather, OVE serves to support the management of important root causes of failure, which, in turn, extends equipment life and averts failure. Overall Vibration Effectiveness drives up Mean-Time-Between/To-Failure (MTBF/MTTF), which is our goal.
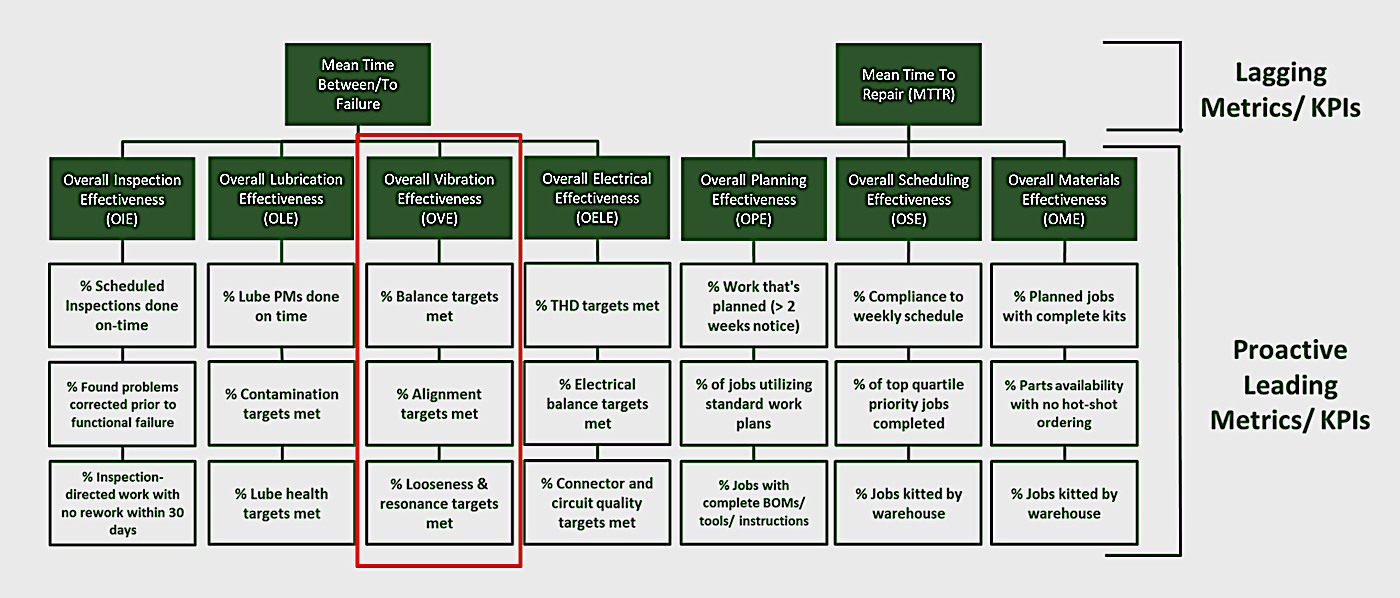
Fig. 1. Overall Vibration Effectiveness (OVE) is a leading indicator
that drives proactive behaviors, which, in turn drive asset reliability.
WHAT OVE IS AND WHY IT’S IMPORTANT
Vibration is a destructive dynamic force that compromises the dynamic clearances of bearings, gears and other machine components, which leads to contact fatigue, abrasion and adhesive wear that leads to failure. It also results in cyclic fatigue that results in failure of bolts and structural elements. Each component responds to vibration differently. As an example rule of thumb, though, reducing the overall vibration of rolling element bearings by half results in an eight-times life extension (Berry, 1995). That means even small improvements to reduce vibration can dramatically affect machine life, reliability, and life-cycle cost of ownership.
We generally refer to vibration in terms of amplitude and frequency. Amplitude describes how much the machine is vibrating and is typically expressed as acceleration (mm/sec2 or in/sec2), velocity (mm/s or in/sec and/or displacement (mm or in). The frequencies at which the machine is vibrating can reveal the nature of the problem or the forcing function that’s creating the vibration. Frequency is typically expressed as cycles per minute or revolutions per minute (CPM/RPM), cycle per second or Hertz (CPS/Hz). We also routinely refer to vibration in terms of multiples of running speed or multiples of gear mesh frequency (GMF).
OVE is calculated by multiplying the following three factors (Fig. 2):
1. Percentage of machines that are mechanically balanced to defined targets.
2. Percentage of machines that are mechanically aligned to specified targets.
3. Percentage of machines that are free of mechanical looseness or resonance.
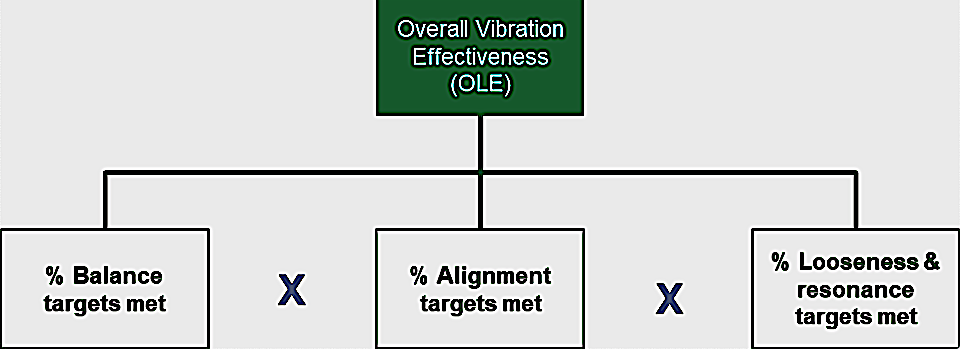
Fig. 2. The simple formula for OVE, which is the product of multiplying
the ‘behavioral inventories’ for the three input factors.
As with the other proactive leading metrics, think of each of the three OVE components/metrics as an inventory process. We’re simply adding up the complying events and dividing by the total.
1. Percentage of Mechanical-Balance Targets Met
To operate reliably, rotating equipment such as pumps, fans, motors, etc., must have an even distribution of mass around the machine’s rotation center. A “heavy spot” results in relative centrifugal force (RCF), a dynamic force that is measurable as vibration at one-time (1X) the shaft’s running speed. Thus, an unbalanced rotor turning at 3,600 rpm would reveal a vibration at 3,600 CPM or 60 Hz. The dynamic unbalance force is linearly related to the mass of the unbalance and its distance from the center of the rotor.
Speed has a multiplicative effect on RCF and its associated vibratory forces. Relatively speaking, assuming the same unbalance mass and distance from the rotation center, a machine turning at 3,600 rpm would produce four times as much RCF as the same machine turning at 1,800 rpm, and 16 times more force than the same machine turning at 900 rpm.
The ISO 21940 standard provides the acceptance standards for precision balancing of rotors using a value known as the “G-unit.” The G-unit simply refers to the machines residual vibration at running speed. In the field, we use peak-observed vibration in mm/s at one-times (1X) running speed as an approximation. For example, 2.5 mm/s is a field approximation of a G = 2.5 in a shop balance environment on a rubber pad. However, be aware that other forcing functions can drive the 1X vibration. For critical systems, we like to balance to a G=1.0 or better. The API 610 standard for turbomachinery in the petrochemical industry calls for a G=0.70 (on the ISO scale) or better. I like to see a G < 2.5 for important balance of plant equipment. The one-times running speed is the machine’s dominant vibration frequency, and it contributes a great deal to the overall vibration, which we employ for calculating life-extension opportunities.
To determine the percentage of balance targets met, simply divide the total number of machines that are operating at or below their specified maximum G-value and divide by the total number of machines being evaluated. Be sure to require that new equipment be precisely balanced as a part of your acceptance criteria. When unbalance is observed in a piece of operating equipment, it’s crucial to quickly field balance or swap it out so it can be balanced in the shop. Unbalance is such a destructive force, especially for high-speed equipment, that it is dangerous to ignore it.
2. Percentage of Mechanical-Alignment Targets Met
Misalignment is another major source of destructive vibration. Centerlines of the shafts of driving and driven components must be free of any angular or offset misalignment, which introduces a wobble that can badly wear bearings, gears, and other components. Misalignment also creates cyclic forces that can lead to fatigue and even the fracture of a shaft.
Because misalignment produces a wobble, we normally identify it as a vibration peak at two-times a machine’s running speed that has higher amplitude than the one-times running speed peak. So, for machine that runs at 3,600 rpm, a peak at 7,200 cpm, or 120 Hz, would typically signify a shaft misalignment. We may also see an increase of vibration at three-times running speed (10,800 cpm, or 180 Hz in our example).
Misalignment in gears is somewhat trickier to detect. You must first calculate the gear-mesh frequency (GMF). This is straightforward for a single-reduction gearbox: You multiply the input speed by the number of teeth on the pinion. So, for a gearset with an input speed of 900 rpm and a pion with 19 teeth, the GMF would be 17,100 cpm, or 285 Hz. If the amplitude of two-times the GMF (34,200 cpm or 570 Hz) exceeds the amplitude of the GMF, you may have a gear-misalignment problem. If the gearset is a multiple-reduction unit, you’ll need to do the math to determine each of the GMFs based upon the speeds and tooth counts for each of the pinions. For V-belts and synchronized belts, misalignment causes an increase in both the one-times and two-times running speeds. Note that there are other industry-specific alignment applications, such as conveyor belts in mining operations. Include them in your percent-compliance for alignment calculations as applicable.
Computing the alignment component of OVE isn’t difficult: Just divide the number of machines that are compliant with alignment targets by the total number of machines being monitored. Attend to misalignment issues promptly.
Fortunately, precision alignment is not as tough as it used to be, thanks to advances in technology. Among them, David Zdrojewski created the “verti-zonta” compound alignment process utilizing true position sensing (TPS), so you’re aligning to true shaft centerlines. It’s much easier than aligning rims and faces. Laser-alignment and dial apps, in particular, can make alignment a breeze. For example, inexpensive laser pulley-alignment tools greatly simplify alignment of belt-drive pulleys. (I personally like the ones that align to the center grooves of the pulleys instead of the shoulders.)
Keep in mind that you must address runout and soft foot before attempting any precision alignment, and always consider thermal growth.
3. Percentage of Mechanical-Looseness and Resonance-Management Targets Met
In my regular job as a consulting reliability engineer, it’s a toss-up as to which is the bigger problem in a plant: lubrication or loose fasteners. If machines are loose, they move around, vibrate, and shake themselves apart. We’re literally talking about the nuts and bolts of mechanical reliability here.
There are many different types of fasteners at a typical plant. Nuts, bolts, machine screws, rivets and nails are temporary fasteners. Hoses and pipes have a variety of connector points. Weldments are common permanent fasteners in the plant. Additionally, we must consider internal looseness. I typically focus on nuts and bolts, bearing and component fits, pipe and hose fasteners, and weldment quality. Nuts and bolts typically represent the largest part of that focus.
To ensure secure bolted connections, we must have the right size of fastener (width and length); the right ISO or SAE grade of fasteners; the right fastener lubricant to reduce friction; the right tools (e.g., calibrated torque wrenches); and the right tightening technique (torque and sequence). Upon inspection, a threaded bolt connection such as mounting a machine to its bases, the flange on a pipe, etc., should exhibit a) no missing or broken nuts or bolts; b) no evidence of self-loosing; c) no short-bolting (2-3 turns of the bolt should extend beyond the end of the nut); d) no incorrect washer usage (e.g., improper size, helical lock-washer for > 5/16” of M8 fasteners); and e) no grade problems (I prefer SAE 5/ISO 8.8 or better unless the bolt is intended to shear).
Tightness can be checked with a properly calibrated torque wrench or preferably with an ultrasonic bolt tensiometer that accurately measures elongation of a bolt, which creates the preload. You could also use a torque marker, like Viz-Torque, to inspect for self-loosened bolts. Finally, vibration analysis can reveal structural or machine looseness by increased vibration at multiples of running speed ranging from two to 10 orders (and sometimes vibration at half-harmonics).
Loose bearing fit-ups can usually be detected by taking phase vibration reading every 30 degrees around the circumference of the bearing. If the bearing is internally loose, the frequency spectrum will look different at each measurement point. Welds can be visually inspected for quality and to check for cracking. Simple weld-measurement tools are available to measure, among other things, leg length, cap reinforcement height on butt welds, and convexity or concavity. Non-destructive testing (NDT) ranging from simple dye penetrant analysis to the very sophisticated radiography offers more robust weld-quality analysis.
Resonance is a condition where the machine is excited by an external or operating vibration at one or more of the machine’s natural frequencies. This results in an amplification of the destructive vibratory forces. Employ a bump test to determine your machines natural frequencies if they’re unknown to you. If you must run at a speed that excites one or more of the machine’s natural frequencies, you’ll be required to add mass or stiffness such that the offending natural frequency is changed and resonance is avoided.
To determine the percentage of machines that are compliant for mechanical looseness and resonance management, simply divide the number of inspection points with no observed problems by the total number of inspection points.
IN CONCLUSION
The proactive management of vibration in our machines is imperative for reliable, safe, and environmentally responsible operation. Start measuring, trending and improving your Overall Vibration Effectiveness (OVE) and watch your MTBF/MTTF increase and your life-cycle cost of ownership decrease.
Next week, we’ll review Overall Electrical Effectiveness (OELE).TRR
(Editor’s Note: This version of the article has been updated to provide a clarification regarding the G-Unit.)
REFERENCES
Berry, L.D., “Vibration Versus Bearing Life,” Reliability Magazine, December 1995.
Troyer, D. (2014). Focus On FLAB (Fasteners-Lubrication-Alignment-Balance) With Proactive and Precision Maintenance. Course Workbook.
Zdrojewski, D., “Precision Shaft Alignment Is Possible.” Reliable Plant, www.reliableplant.com/Articles/Print/7945.
(Accessed 19 June 2021.)
ABOUT THE AUTHOR
Drew Troyer has over 30 years of experience in the RAM arena. Currently a Principal with T.A. Cook Consultants, he was a Co-founder and former CEO of Noria Corporation. A trusted advisor to a global blue chip client base, this industry veteran has authored or co-authored more than 300 books, chapters, course books, articles, and technical papers and is popular keynote and technical speaker at conferences around the world. Drew is a Certified Reliability Engineer (CRE), Certified Maintenance & Reliability Professional (CMRP), holds B.S. and M.B.A. degrees. Drew, who also earned a Master’s degree in Environmental Sustainability from Harvard University, is very passionate about sustainable manufacturing. Contact him at 512-800-6031, or email dtroyer@theramreview.com.
Tags: reliability, availability, maintenance, RAM, metrics, key performance indicators, KPIs, vibration, resonance, torque, fasteners, lubrication, alignment, balancing, FLAB

