
We’ve all heard that “what gets measured gets done.” That’s because metrics and key performance indicators (KPIs) drive behaviors. Unfortunately, most of our maintenance and reliability KPIs are lagging in nature. While they reveal where we’ve been—which is important—they sometimes fail to point to the direction in which we should be heading. That’s the job for leading metrics.
I’ve devised a range of leading metrics that are designed to promote proactive and precision behaviors in the plant (Fig. 1). Some drive increased reliability, as measured by mean time between failure (MTBF), while others drive improved maintenance, as measured by mean time to repair (MTTR).
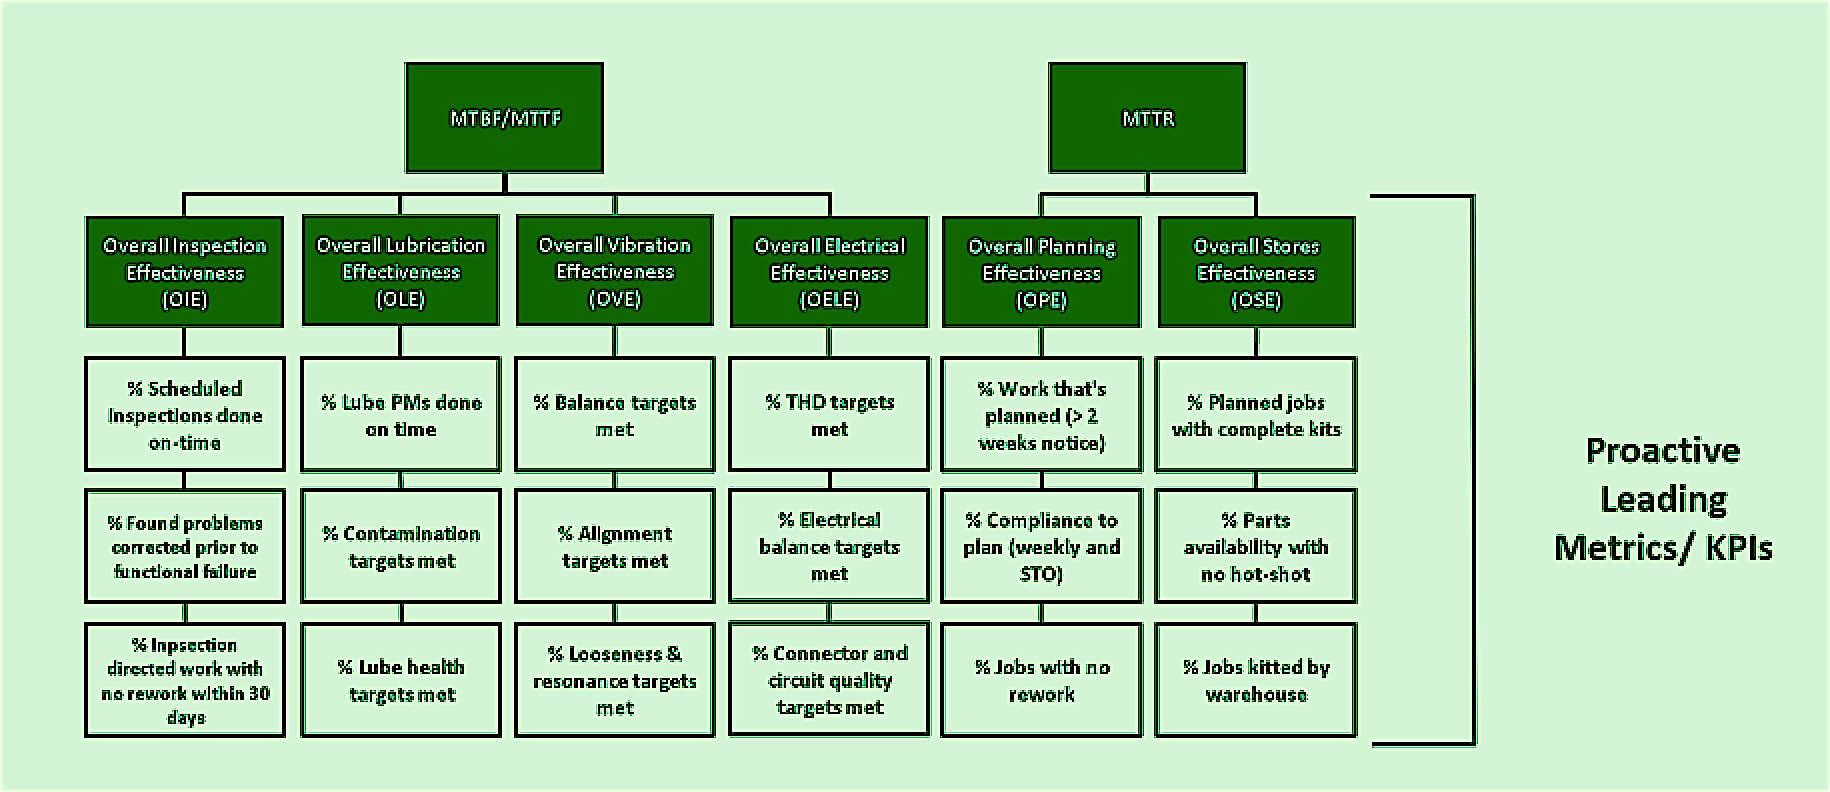
Fig. 1. Map of leading indicators for precision and proactive maintenance linked to MTBF and MTTR.
I’ve created this range of metrics to mimic the elegant and easy-to-understand and -implement overall equipment effectiveness (OEE) metric pioneered as a part of the Toyota Production System. All of these leading metrics are trended as a percentage and based upon relatively binary observations, which makes them easy to implement.
My leading KPIs for precision maintenance (along with the formula for each) include the following:
Overall Inspection Effectiveness (OIE) =
% Inspections done on Time X % Found problems fixed before functional failure X % of Inspection-directed work
with no rework within (specified) number of days
Overall Lubrication Effectiveness (OLE) =
% Lube PMs done on time X % of machines within contamination targets X % Machines within lube-health targets
(oil analysis or ultrasonic)
Overall Vibration Effectiveness (OVE) =
% Machines within balance targets X % Machines within alignment targets X % Machines within looseness
and resonance targets
Overall Electrical Effectiveness (OELE) =
% THD targets met X % Electrical balance targets met X % Connector and circuit quality targets met
Overall Planning Effectiveness (OPE) =
% of work that’s planned (> 2 weeks advance notice) X % Compliance to plan X % Jobs with no rework
Overall Stores Effectiveness (OSE) =
% Jobs with complete kits X % Parts available with no hot-shot procurement X % inventory turns relative to goal
Remember that proactive metrics and KPIs lead to proactive behaviors in a plant. I look forward to your feedback about these leading metrics and particular KPIs for driving proactive and precision maintenance behaviors.TRR
ABOUT THE AUTHOR
Drew Troyer has 30 years of experience in the RAM arena. Currently a Principal with T.A. Cook Consultants, he was a Co-founder and former CEO of Noria Corporation. A trusted advisor to a global blue chip client base, this industry veteran has authored or co-authored more than 250 books, chapters, course books, articles, and technical papers and is popular keynote and technical speaker at conferences around the world. Drew is a Certified Reliability Engineer (CRE), Certified Maintenance & Reliability Professional (CMRP), holds B.S. and M.B.A. degrees, and is Master’s degree candidate in Environmental Sustainability at Harvard University. Contact him directly at 512-800-6031 or dtroyer@theramreview.com.
Tags: reliability, availability, maintenance, fasteners, lubrication, alignment, balance, vibration, energy efficiency, energy costs, cost-benefit analysis, workforce issues

